Why Do Data Dashboard, ERP and Excel Figures Differ, and How Can You Find the Cause?
When dashboard figures disagree with ERP or Excel, first compare the same reporting scope, permissions and data snapshot. Then recalculate each step—source records, transformation, API response and page display—to find where the first difference appears. Comparing two totals alone rarely reveals whether records are missing, counted twice, filtered differently or still showing an old result at one stage.
On this page 6 sections
This article gives business, data and development teams a joint troubleshooting method for an existing discrepancy. If the metric itself has not been defined, start with a management cockpit metric definition sheet. Here the focus is tracing a discrepancy to the particular records and processing step once the definition is agreed.
Put Both Results Under the Same Conditions
“Viewed on the same day” does not mean “calculated from the same data.” Preserve screenshots, query filters, viewing roles, export time and last successful data-update time for both results. Then choose a small, recalculable record set. A data snapshot for this comparison means either the same records held unchanged while checking or a shared cutoff point that both sides can reproduce.
Scroll the table horizontally to see the full comparison.
| Check first | How differences arise | Hold constant for this comparison |
|---|---|---|
| Time range | One side uses order time, the other approval time; calendar day differs from business day; time zone or end boundary differs. | Time field, zone, start/end boundaries and cutoff. Record the actual rule, such as “include the start, exclude the end.” |
| Business scope | Cancelled, refunded, draft or test records may be treated differently; organization and product filters differ. | The same metric version, organizational scope, business statuses and filters. Do not change the definition halfway through diagnosis. |
| Access permissions | An administrator sees the whole company while a departmental account sees one department; export and page permissions may differ. | Compare equivalent authorized data scopes. Record the roles and organizations used; do not compare totals from accounts with different permissions directly. |
| Update batch | Excel changes are unsaved; new source records exist but synchronization or the model still uses the previous batch. | Source-file version, data cutoff and synchronization or refresh result. Distinguish job completion time from the business-data cutoff. |
| Grain and units | Product detail rows are counted as orders; yuan and ten-thousand-yuan units are mixed; amounts are rounded per row before totaling. | What one record represents, whether to count rows, distinct values or sums, and at which stage conversion and rounding occur. |
If the conditions really differ, explain that difference before deciding whether to align definitions. Do not assume ERP or Excel is necessarily correct simply because of its source.
Worked Example: Why Do Three Valid Detail Rows Represent Only Two Orders?
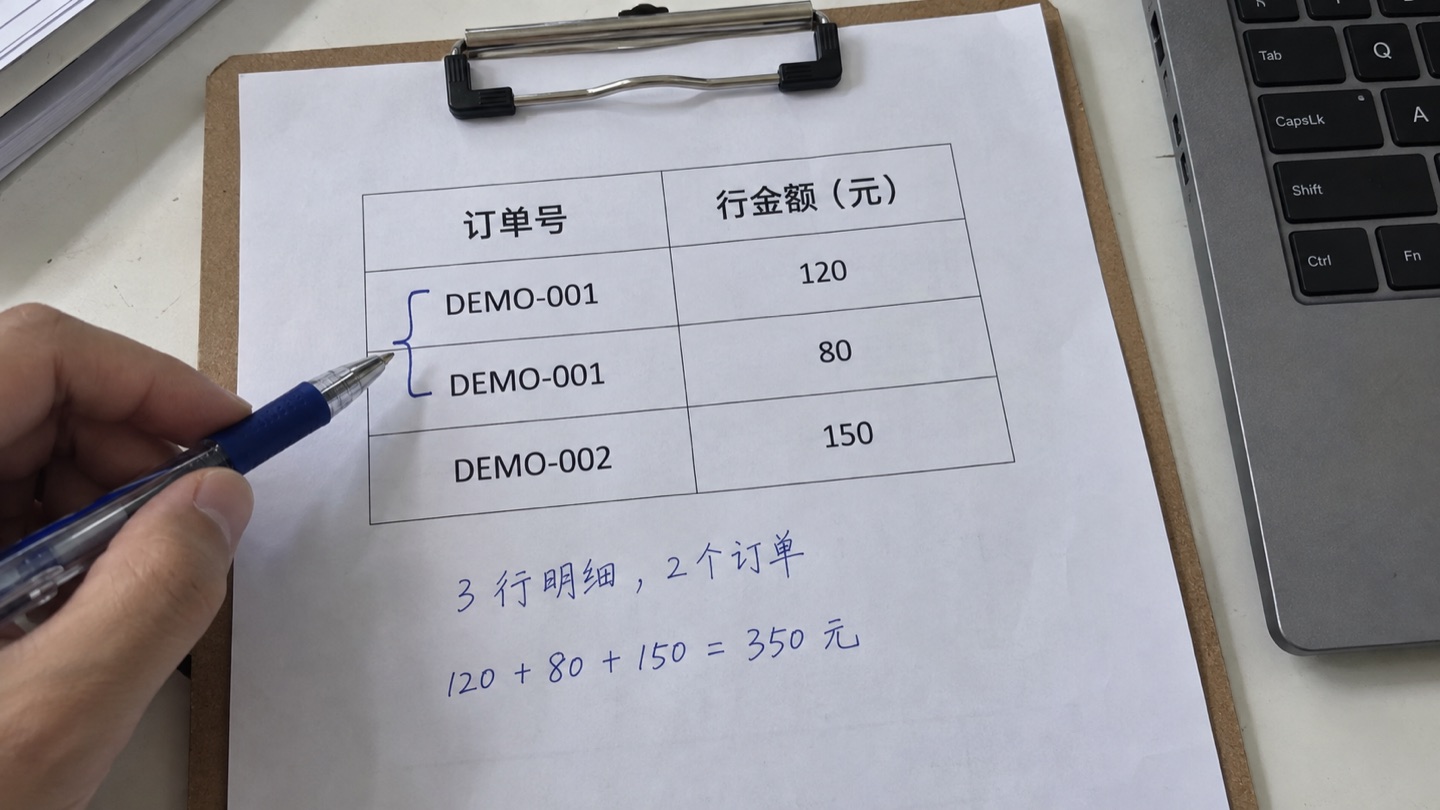
The four rows below are invented solely for this article; they are neither customer data nor a Hongshan Technology project result. All four rows belong to one demonstration organization on one reporting day, and order IDs are unique within that organization. The example uses order placement time to define the day and reads statuses from one snapshot. It counts only “Confirmed” orders and excludes “Cancelled” ones. Row amounts exclude tax, refunds and currency conversion.
Scroll the table horizontally to see every column.
| Order ID | Detail row | Order status | Row amount (CNY) |
|---|---|---|---|
| DEMO-001 | 01 | Confirmed | 120 |
| DEMO-001 | 02 | Confirmed | 80 |
| DEMO-002 | 01 | Confirmed | 150 |
| DEMO-003 | 01 | Cancelled | 50 |
Under these rules, the filtered data has 3 valid detail rows, 2 distinct valid orders and a row-amount total of 120 + 80 + 150 = CNY 350. If ERP reports 2 “total orders” but the dashboard shows 3, first check whether the dashboard counts detail-table rows. Three may be a correct detail-row count, but it is not the order count defined here.
Now consider the amount: the order-header total for DEMO-001 is CNY 200 and for DEMO-002 is CNY 150. If header totals are repeated after joining to detail rows and then summed, the result becomes CNY 200 + 200 + 150 = CNY 550. The difference comes from the grain after the join. In this example, sum row amounts, or retain one header row per order before summing.
Do not treat “add distinct” as a universal fix. Confirm whether order IDs repeat across organizations, whether an order can be recorded in stages and how status changes are represented. Determine the unique key and the object being counted before changing the calculation.
Find the First Difference Along the Data Path
For a small set of discrepant orders, record input version, filters, record count, order IDs and amounts at each stage. If adjacent stages differ, decide whether the change follows the agreed rule. For example, expanding orders into detail rows normally increases the row count; counting those rows as orders is the mistake.
Scroll the table horizontally to see the full comparison.
| Stage | Specific check | How it narrows the cause |
|---|---|---|
| 1. Source records | Compare order IDs, detail-row IDs, times and statuses in one snapshot; separately list records present on only one side. | If source sets already differ, inspect source, export scope or cutoff before changing a page formula to force totals to match. |
| 2. Transformation | Inspect records after reading, type conversion, filtering, joining, deduplication and aggregation. Preserve the distinction between order and detail grain. | Find the first step that drops or duplicates a record or changes an amount against the rules. Inspect its join keys, conditions and error handling. |
| 3. API response | Check the response with the exact organization, role, time and filter parameters used by the page; verify field meaning, pagination and aggregation. | If transformed data is correct but the response is not, inspect API filters, parameters, serialization and cache version. Do not assume the response field total is the business order total. |
| 4. Page display | Compare raw response with cards, charts, details and exports. Check field binding, second-stage aggregation, units, rounding and hidden filters. | If the API is correct but display is wrong, focus on page configuration and calculation. If only one role or filter is affected, keep that combination fixed during reproduction. |
| 5. Update path | Compare the versions and success states of source updates, sync jobs, model or aggregation results, API cache and page display. | If each stage calculates correctly from the same old snapshot but production still differs, find which stage missed the target batch rather than repeatedly refreshing the browser. |
For the worked example, if transformation and API both return 2 orders but the card shows 3, check the page binding or secondary calculation. If transformation has already summed repeated header amounts to CNY 550, the join and aggregation must be fixed even when the page faithfully displays the API.
Where Else Should You Look for These Symptoms?
Every Department Shows the Same Value
Check whether the department filter actually reaches the data, whether join fields and types match, and whether relationships propagate filters as intended. For Power BI, Microsoft recommends inspecting query results in a table or matrix and checking relationships, cardinality, active state and filter direction. It also notes that the same value appearing for every group can result from a missing relationship or a filter that does not propagate. Do not misread the company-wide total as equal performance by every department. Reference: Troubleshoot Power BI Relationships.
Excel Looks Right, but Import or Refresh Changes the Result
Preserve the failing step and error message. Check recent changes to table or column names, headers and types; identify rows converted to null or error or filtered out. Microsoft’s Power Query documentation notes that source-table or column renames can break query steps and type changes can cause errors or surprising results. Do not replace every failed conversion with zero and call the data correct. Reference: Handle Power Query Data Source Errors.
The Number Is Still Old After Clicking Refresh
Identify which layer was refreshed. In Power BI import mode, refreshing a visual reads data already imported into the semantic model; new source changes require the appropriate model-data refresh to finish. Once the model updates, visuals in an already open report may need another refresh. The refresh history and data cutoff explain freshness better than a “just refreshed” message alone. Reference: Types of Power BI Data Refresh.
These product behaviors only illustrate where to investigate. For a custom dashboard using APIs, a database or file synchronization, inspect that project’s actual update path rather than assuming another BI product’s buttons, license quotas or refresh mechanism.
How to Prove the Difference Is Resolved
Acceptance evidence should show what went wrong, what changed and the result after recalculating from the same input. Replay the original failing snapshot, then test a new record set that was not used to design the fix. Matching totals alone are insufficient: compare record sets and detail too, so one missing and one extra record do not cancel each other out.
- The original problem is reproducible and explainable. Keep the pre-fix result, differing records, cause and location of the change. In this example, record that detail rows were counted as orders or repeated order-header amounts were summed after a join.
- The same input can be recalculated. With the same definition, snapshot, permissions and filters, retain source details, calculation steps, API response and page result. The example should yield 2 valid orders, 3 valid detail rows and CNY 350.
- Boundary cases still follow the rules. Recheck cancelled records, duplicate IDs, nulls, time boundaries and amount precision. Counts should match exactly under the agreed rule; set any tolerance for rounding or sampling in advance rather than widening it to hide an error.
- Every downstream reference is covered. Check the overview card, trends, details, exports and other pages using the metric. Test each role against its authorized scope; a restricted role should not be expected to see all data.
- The next refresh retains the result. After the next real update, recheck cutoff, error state and the same comparison items. Confirm the fix did more than change one static screenshot.
After locating the cause, record the reason, version, affected pages, owner and recalculation evidence in the Metric Governance and Data Lineage Acceptance Matrix. If the business definition must change rather than correcting an implementation error, first use a metric-definition review to approve old and new rules and their effective scope.
What to Prepare for a Joint Investigation
Bring both conflicting results and their filters, a small set of redacted differing records, the current metric rules, and data-update time or failure message. There is no need to share the entire system; reproducing one concrete discrepancy helps determine whether the business owner, data team or page developer needs to join next.
Use the BI Dashboard and Data Integration Service to describe existing systems, users and affected pages and define the data range to investigate. For an example of presentation structure, see the Enterprise Management Cockpit Solution and Case; the worked example in this article does not come from that solution.