Can a company build a digital twin factory without MES?
Yes. Start with ERP, Excel, equipment collection or manual reports and prioritize a dashboard of key metrics. Connect MES, SCADA and IoT systems in later stages if needed.
Summary: Traditional production reports mainly support after-the-fact statistics; a digital twin factory also needs current status, process analysis, exception warnings and decision support. Before starting a smart-factory or digital-twin project, organize production, equipment, quality, energy, inventory, alarm and integration data.
A digital twin factory is not simply a report displayed on a larger screen or a 3D workshop. A useful system connects the shop floor, equipment, orders, quality, energy and inventory.
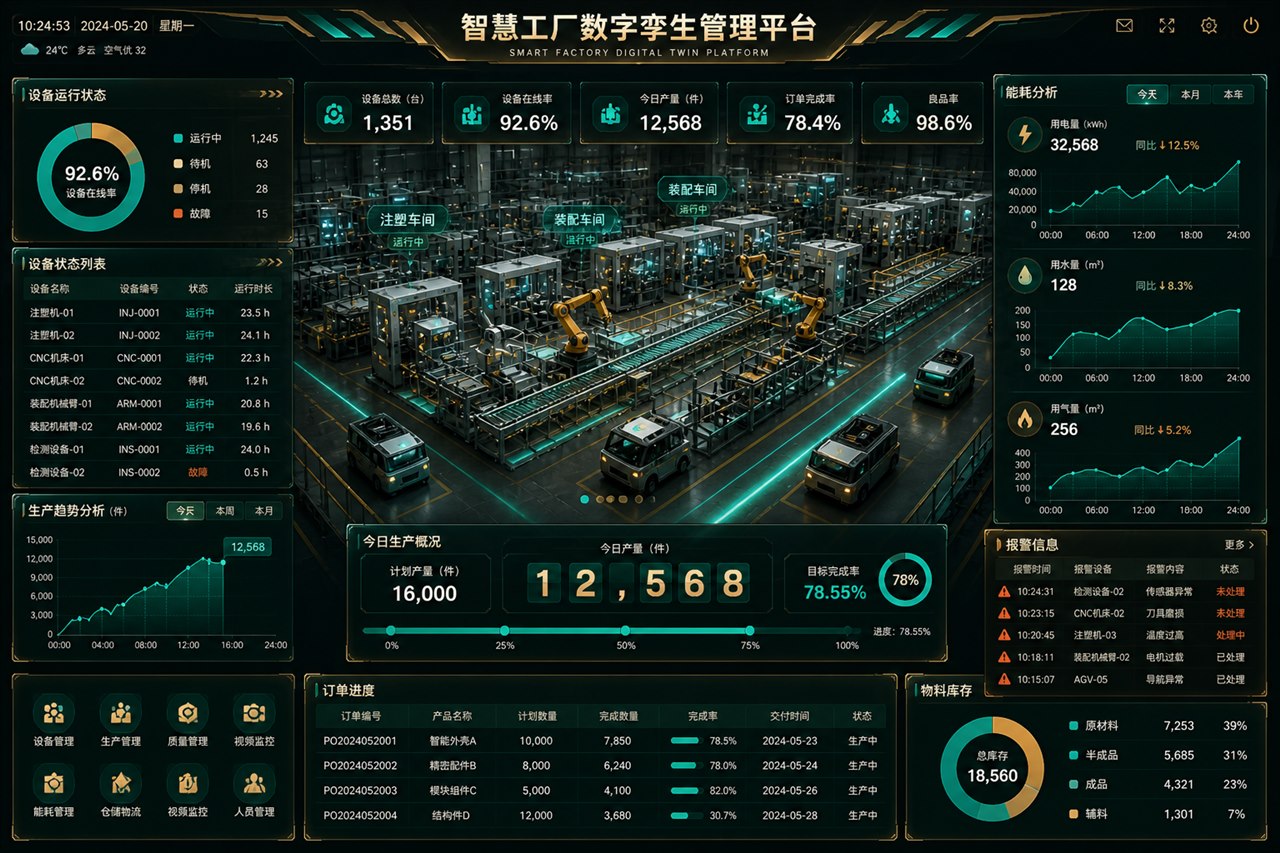
The system first needs to know what is scheduled today, how much is planned and how far production has progressed. Gather order IDs, product names, planned and actual output, target and actual delivery dates, batches, work-order status, lines and shifts.
This data may come from ERP, MES, production-planning sheets or manual registers. If Excel is still the main source, standardize its fields first and connect systems in stages.
Equipment data underpins smart-factory dashboards and digital twins. Without operating data, a 3D workshop remains a presentation layer rather than a view of real production.
A digital twin factory should show not only how much was produced but also how well. Prepare inspection batch and time, inspector, accepted and rejected quantities, yield, defect types, rework and product traceability.
When quality and production data are connected, the system can reveal a line whose output rises while yield falls, prompting a closer look at equipment settings, raw-material batches or process state.
Energy data matters increasingly in manufacturing digitization. Organize electricity, water and gas use; energy by workshop and line; energy per unit; peak/off-peak electricity; exceptions; and efficiency targets.
Combined with production data, energy measures show differences among lines, shifts and product types, supporting efficiency analysis and cost control.
Many factories are constrained less by equipment than by poor visibility of raw materials, work in progress and finished stock. Before implementation, organize stock levels, material IDs, batches, suppliers, inbound/outbound records, warning thresholds and links from materials to work orders.
When inventory is connected to production plans, shortages, overstock and delivery risks can be seen earlier.
For a 3D digital twin factory, prepare plant plans, workshop and line layouts, equipment photos, CAD drawings of key machines, process diagrams, point maps and camera locations.
More complex modeling is not automatically better. A management cockpit emphasizes the overall picture, equipment monitoring emphasizes key device status, and visitor presentations emphasize visual quality. Hongshan Technology generally chooses model scope and fidelity against the business goal.
A digital twin should do more than show normal operations: it should reveal exceptions, alert the right people and track outcomes. Define alarm types and severity, sources, trigger conditions, owners, response deadlines, results and verification records.
Equipment failure, output variance, unusual energy use, quality problems and material shortages can each require different warning rules. That makes the system part of daily management rather than only a display.
| Data source | Common content | Preparation focus |
|---|---|---|
| ERP | Orders, customers, materials, purchasing and stock. | Confirm field definitions, integration and update frequency. |
| MES | Work orders, output, steps, shifts and quality. | Confirm work-order states, production pace and traceability. |
| WMS | Raw material, work in progress, finished goods and stock movements. | Confirm batches, warning thresholds and order links. |
| SCADA / PLC / IoT | Equipment states, operating parameters and alarms. | Confirm collection points, refresh intervals and error states. |
| Energy system | Electricity, water, gas, usage curves and exceptions. | Confirm submetering and energy-per-unit definitions. |
| Video surveillance | Camera points, live feeds and linked events. | Confirm access permissions, point locations and linkage rules. |
Starting with important workshops, lines and devices may be more practical than connecting every system at once. Establish stable definitions and usable pages, then expand to other business contexts.
Yes. Start with ERP, Excel, equipment collection or manual reports and prioritize a dashboard of key metrics. Connect MES, SCADA and IoT systems in later stages if needed.
Not always. 3D helps show the spatial relationship among plants, workshops, lines and key devices. If the immediate priority is management analysis, output statistics or device monitoring, a 2D dashboard or cockpit may be a better first step.
Common sources include ERP, MES, WMS, SCADA, PLC, IoT platforms, energy systems and video. Choose the integration scope from management goals rather than connecting everything at once.
Prioritize plans, actual output, equipment state, quality, energy, inventory and alarms. These directly reflect operating efficiency and management risk.
The main factors are source-system complexity, API availability, model fidelity, feature count, depth of site discovery and speed of customer approvals. More standardized data usually makes delivery smoother.
Hongshan Technology supports smart factories, dashboards, 3D modeling, digital twin platforms and enterprise software, from requirements and data planning to interface design and system development.
Related services: Digital twin visualization development, Data dashboard development, Custom enterprise software development. Related solution: Smart Factory Data Dashboard Solution. Related case: Smart Factory Production Monitoring Dashboard Case.