Dongsheng Town Collective Industrial Park Operations Dashboard: A Case Analysis
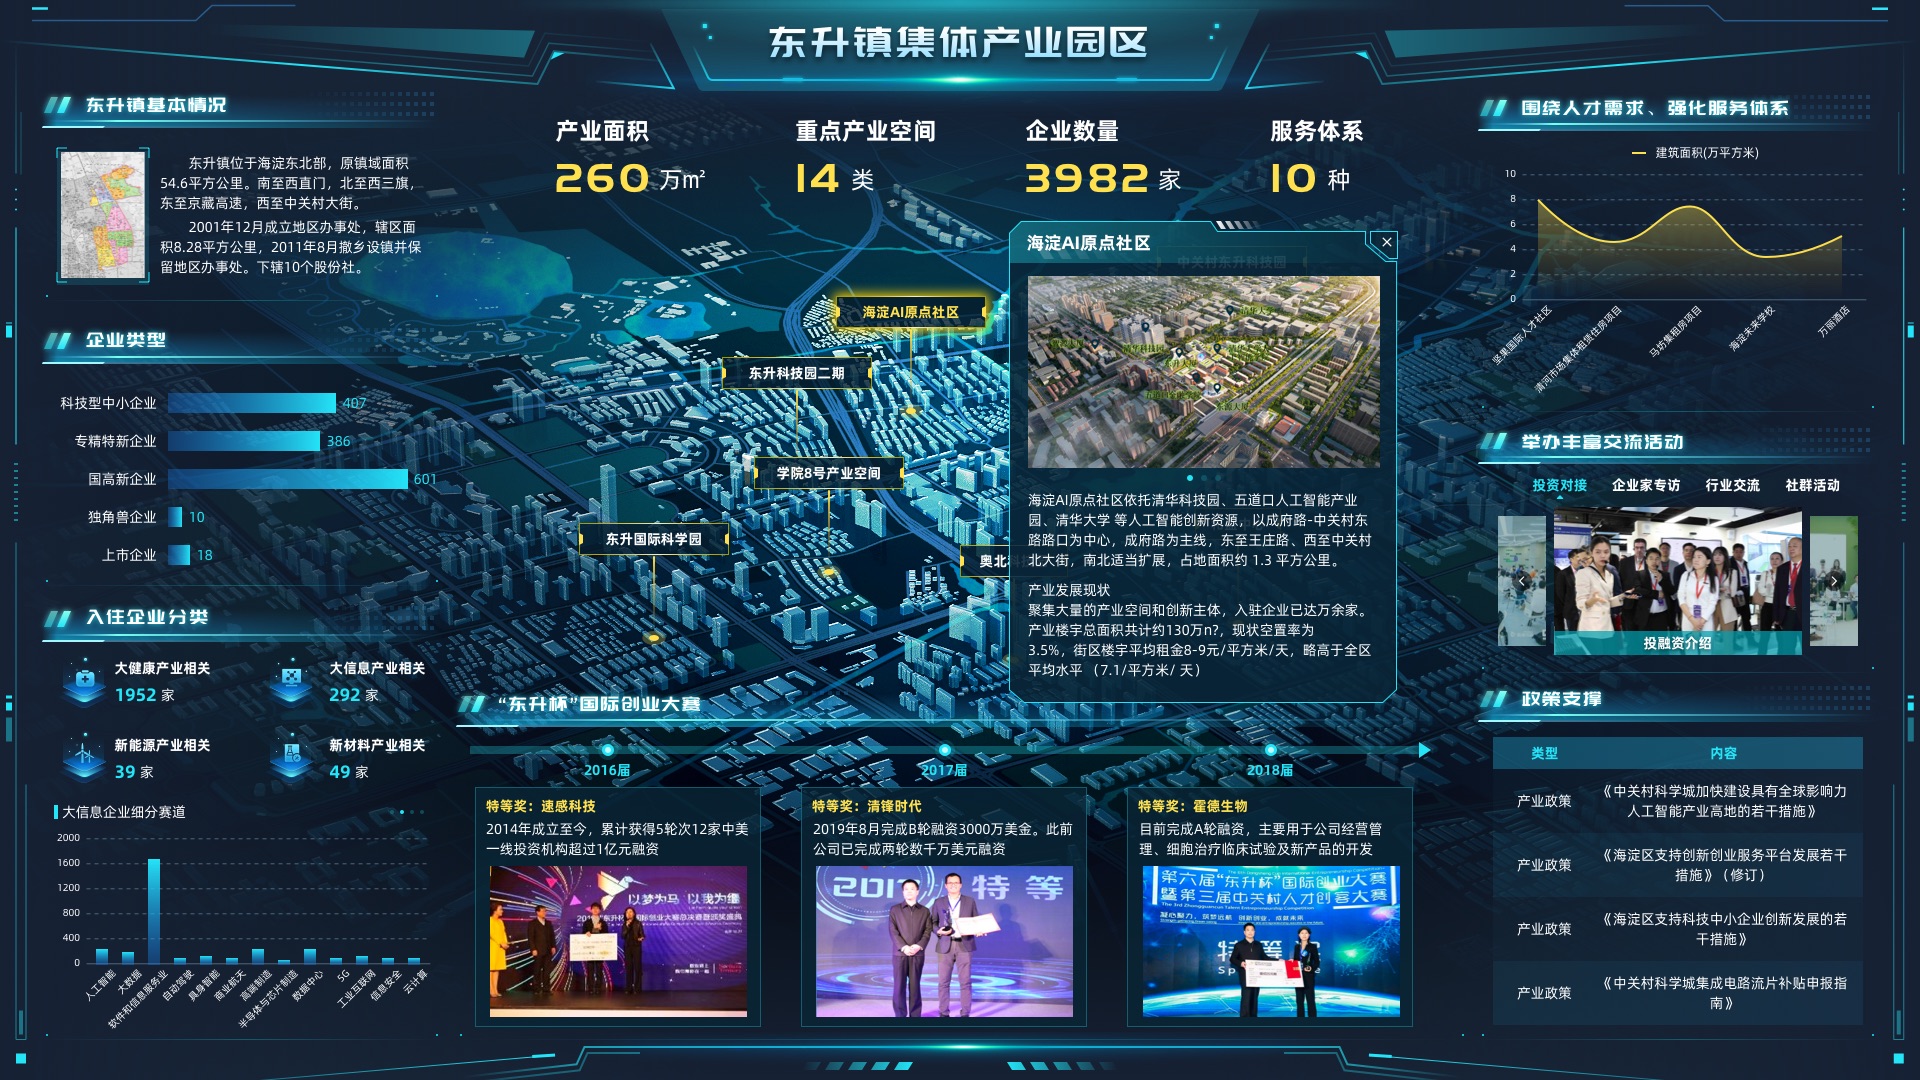
Case overview: The dashboard brings industrial space, company profiles, talent services, networking events, policy support, and startup competitions into one operations view. It supports park leasing and results reporting while leaving clear entry points for future enterprise services, policy applications, and space management.
For the full interface, module descriptions, and use cases, see the Dongsheng Town collective industrial park operations dashboard case (Chinese).
Which operations questions does the dashboard answer first?
An industrial park dashboard should first answer four kinds of question: how much industrial space exists, which companies are present, which services are offered, and what outcomes have been achieved. This case shows 2.6 million square meters of industrial space, 14 types of key industrial space, 3,982 companies, and 10 kinds of support service at the top, establishing the park's scale and management scope.
| Information layer | Main content | Operations question answered |
|---|---|---|
| Top-level measures | Industrial area, key space types, company count, and services | What are the park's overall scale and resource base? |
| Central spatial view | 3D map, priority areas, industrial premises, and detail popups | Where are key spaces and how are they distributed? |
| Company profiles | Qualification categories, industry classes, and company counts | What is the company mix and industry concentration? |
| Services and policy | Talent support, networking, investment matching, and policy support | What services can the park offer companies? |
| Competition outcomes | Competition editions, winning companies, and growth information | What phase results has industry cultivation produced? |
Why put industrial space at the visual center?
Spatial information underpins leasing, enterprise service, and park reporting, so the case puts the 3D city and park in the center. The map labels key nodes including Haidian AI Origin Community, Dongsheng Science and Technology Park Phase II, Xueyuan No. 8 Industrial Space, Dongsheng International Science Park, and Aobei Science and Technology Park, tying resources to locations.
In an operational system, the central map can also support area drilldowns, building vacancy, leasable area, rents, transport access, and tenant status. Its role is to help managers locate and compare industrial premises, not merely provide a background.
Why is a total company count insufficient?
A total shows park scale, while company types and industry classes show its composition. The case lists 407 technology-based SMEs, 386 specialized and innovative companies, 601 national high-tech companies, 10 unicorns, and 18 listed companies, alongside healthcare, information technology, new energy, and new materials categories.
Actual systems need clear counting rules because one company can hold multiple qualifications. Company profiles can also connect industry, size, funding stage, talent needs, floor-area use, policy-application status, and service records to support leasing, operations, and management decisions.
How can the park's service system become operational data?
A park service view must show both what is offered and what happened. On the right, the case presents talent demand, trends in building area, investment matching, entrepreneur interviews, industry exchanges, and community events. Park services extend beyond physical space to talent, finance, activities, and relationships with companies.
An everyday operations system can also track companies served this month, investment introductions, policy consultations, event registrations, request handling, and visits to key companies. Combining service descriptions with process data lets the dashboard move from results presentation to operational review.
What should the policy-support module show?
Companies need to see whether a policy applies, what support it provides, when to apply, and which materials are required. The case lists policy directions for artificial intelligence, innovation and entrepreneurship platforms, technology-based SMEs, and integrated-circuit tape-out subsidies as entry points.
A production system can organize policy by company type, sector, stage, and application status. Show eligible applicants, support, conditions, materials, deadlines, and progress. This helps companies find policies and park staff follow the service process.
How can startup competitions become measurable operations outcomes?
Competition modules should connect events with companies' subsequent development, not just display award photos. The case shows the Dongsheng Cup international startup competition as a timeline and highlights winners such as Sensing Technology, LuxCreo, and Hode Biotech.
Competition records can link applications, judging, awards, financing, tenancy, partnerships, and policy services. This both shows reach and helps assess whether an event has produced lasting leasing or industry-development outcomes.
Which pages does a deliverable park operations system need?
- Park overview: Show regional location, industrial area, company count, key industrial space, and service capability.
- Space inventory: Show areas, buildings, leasable space, vacancy, rents, and leasing status.
- Company profiles: Show sectors, qualifications, development stages, priority companies, and service records.
- Service operations: Show activities, policies, investment matching, talent support, and company requests.
- Outcomes review: Show competitions, leasing, policy applications, company growth, and phase measures.
Showroom projects can emphasize 3D maps, key areas, and results. Day-to-day systems should put company services, leasing leads, policy applications, and task closure first. Defining main users and frequency before work starts keeps presentation and operational needs from competing on every page.
What data should be prepared before starting?
| Material category | Recommended materials |
|---|---|
| Spatial materials | Park boundaries, area and building inventories, leasable space, CAD plans, GIS data, or 3D models |
| Company materials | Company list, industry categories, qualification tags, stage, space use, and definitions of priority companies |
| Operations materials | Services, activity records, competition materials, investment matching, requests, and visit logs |
| Policy materials | Policy inventory, eligible applicants, conditions, required documents, deadlines, and processing state |
| Technical materials | Existing systems, databases, APIs, update rates, access scope, deployment environment, and acceptance requirements |
If APIs are not ready, sample sheets and historical reports can define page structure. But terms such as “company count,” “priority company,” “industrial space,” and “service item” need aligned definitions early. Design, development, integration, and acceptance can then work against the same rules.
How can the interface remain clear?
Use verifiable business names and actions instead of slogans such as “all-domain empowerment,” “smart hub,” or “everything on one screen.” Under a heading about strengthening services, list the actual talent events, investment matching, policy guidance, company requests, and priority-company visits so readers know what the page contains.
Keep titles, metric units, update times, statistical scope, and detail entry points consistent. For a long-lived operations system, explaining what data is, where it comes from, and when it changes matters more than adding decoration.
What scenarios suit this kind of park dashboard?
- Integrated operations displays for industrial parks, innovation parks, and urban renewal districts.
- Results reporting for leasing centers, enterprise service centers, and park showrooms.
- Industrial-space management, company profiling, and services for priority companies.
- Policy applications, investment matching, activity operations, and startup competition reviews.
When a project spans space, companies, policies, services, and outcomes, a park operations cockpit can provide a single entry point. For one focused topic, a separate data dashboard is more efficient and avoids irrelevant modules.
Related case and resources
See the Dongsheng Town collective industrial park operations dashboard case (Chinese), smart park operations cockpit solution (Chinese) and how to build an industrial park leasing and operations cockpit for the project interface and possible system structure.
For project preparation, also review what a smart park dashboard should include, the dashboard project startup materials checklist, how to start before APIs are ready and common dashboard acceptance gaps.