How to Choose a Digital Twin Visualization Company
Check whether the team can handle modeling, points, data integration, interaction logic and private deployment.
Summary: A smart park dashboard is more than cameras placed beside a map. It should build a coherent view of space, equipment, people, vehicles, energy, security, alarms and operating metrics.
The overview usually shows park area, building count, tenant companies, foot traffic, vehicle count, equipment online rate, today’s alarms and energy use. It should let managers quickly judge whether the park is operating normally.
If the park serves leasing, property management, security, maintenance and energy teams, compress their key indicators into a small set of core states. A busy-looking screen is not necessarily actionable.
A smart park project may need a 2D map, a 3D park scene or layered building plans. The map should connect to buildings, roads, parking areas, cameras, access control, equipment and alarm points; it should not be merely decorative.
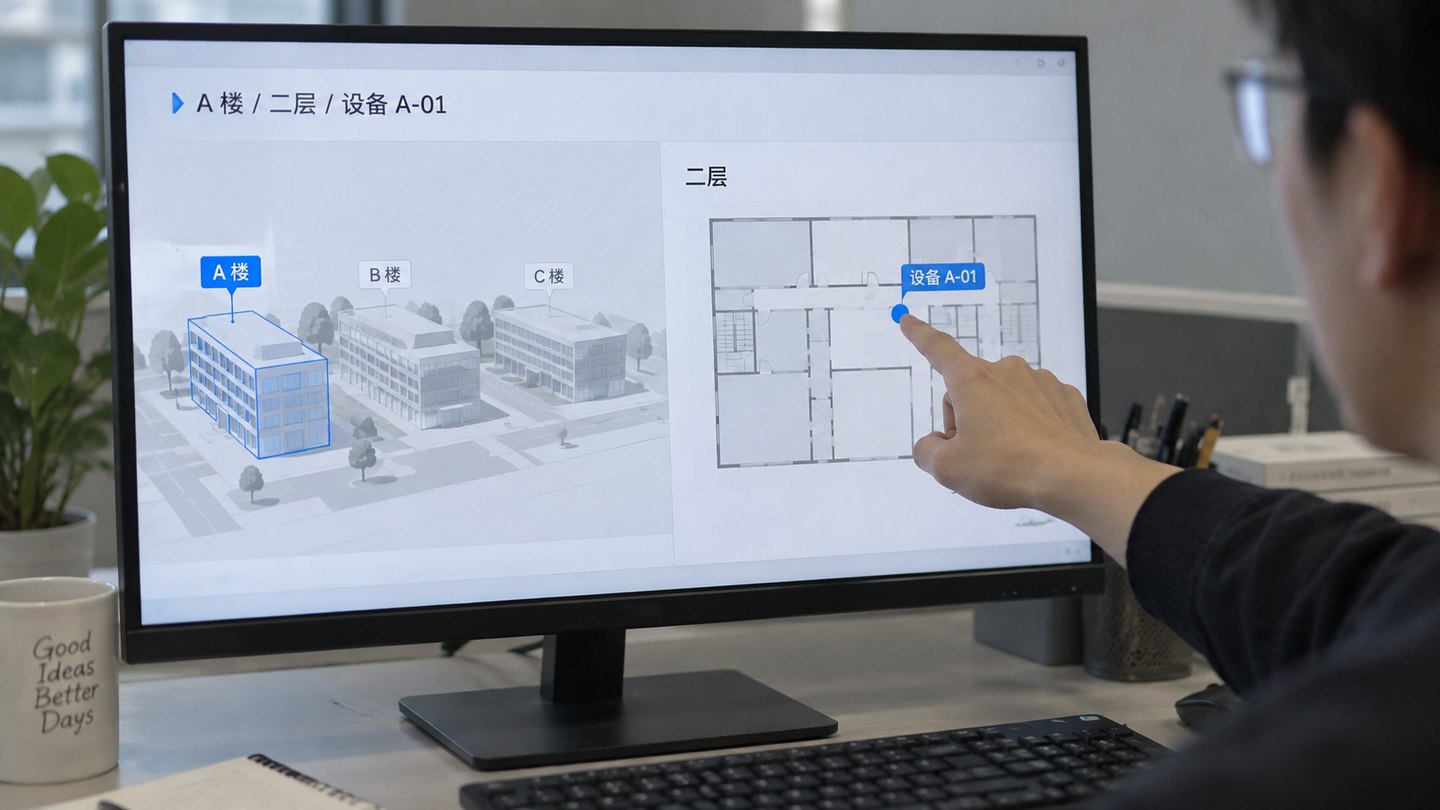
The spatial view should answer where a problem occurred. When equipment goes offline, a fire alarm sounds, traffic backs up or energy use spikes, users should be able to locate the building, floor or area quickly.
Common modules cover video monitoring, access control, fire protection, power distribution, HVAC, elevators, lighting and charging stations. Link equipment state to alarms, work orders and responsible people to track day-to-day maintenance.
Enterprise parks often have equipment from different vendors and platforms. Clarify interface capabilities, refresh rates and alarm fields before development so the dashboard does not end up showing static icons only.
Energy use can be grouped by building, area, time and type for efficiency analysis. Operating metrics may include occupancy, leased area, parking turnover, visitor volume and service work orders.
A park operations cockpit can often use four levels: overall status, building and area details, focused modules such as energy, parking, security and maintenance, and an alarm-to-work-order closure view. Leaders get an overview while each team can reach its own module.
A display-oriented project may emphasize an aerial park view, building distribution, leasing highlights and results. An operations-oriented project should emphasize equipment state, alarm response, energy trends, work-order efficiency and permission levels.
Before starting, prepare site plans, building information, equipment inventories, point lists, system APIs, energy and parking data, and regular operations reports. Beijing Hongshan Technology can use the presentation goal to determine whether a 3D park, 2D map, operations cockpit or linked multi-screen view is appropriate.
The problem is often fragmented systems, not the page. Parking, access control, security, energy, property work orders and leasing data may come from different platforms with inconsistent fields and refresh rates. Simply combining screenshots can create a page with content but no useful management entry point.
Before development, decide what belongs in the shared overview, what needs a focused page and what can only be shown statically for now. This keeps the first phase manageable and protects the delivery schedule.
Related solution: Smart Park Operations Cockpit Solution. Related cases: Smart Park Dashboard Case, Zero-Carbon Park Smart Operations Visualization Case. Further reading: How to Build a Leasing and Operations Cockpit for an Industrial Park.
Park projects should also assess digital twin capabilities, preparation materials and solution scope.
Check whether the team can handle modeling, points, data integration, interaction logic and private deployment.
Park projects typically need plans, building information, point lists, APIs and alarm rules together.
Compare how the proposed modules, metric views and page levels are organized.