Can an emergency command dashboard be built before real-time APIs are ready?
Yes. A project can validate page structure with de-identified data, Excel, admin entry, or static APIs, then connect live business systems in stages.
Summary: An emergency command center visualization should organize pages around incident status, map points, resource dispatch, response process, risk areas, and progress, rather than producing only a static dashboard rendering.
Emergency command centers commonly need to show incident severity, resource locations, response time, handling process, risk areas, plan linkage, and team status together.
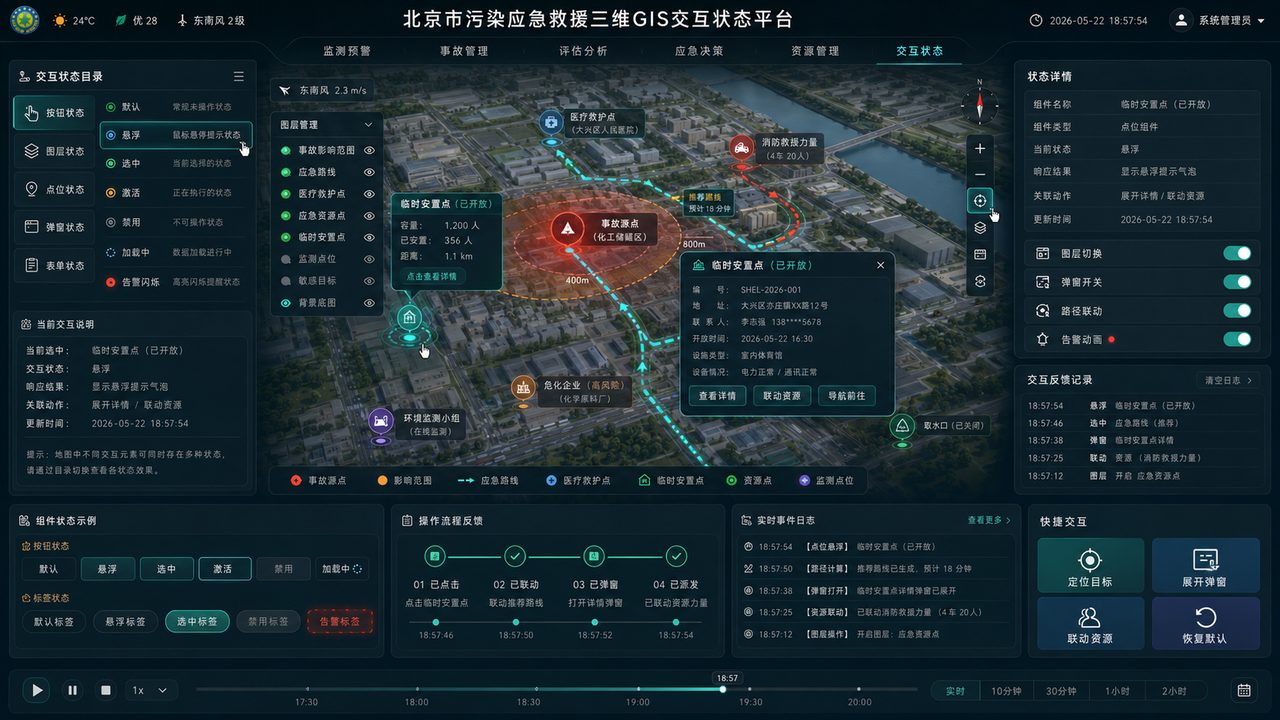
An emergency command dashboard may support routine duty, live incident response, executive reporting, coordinated dispatch, or post-incident review. Each gives maps, metrics, lists, and workflows a different priority. Identify the main viewers and how they will use it before design begins.
Emergency projects often use a map as the main view of incident locations, affected areas, teams and resources, risk zones, and nearby points. Place the incident list, resource totals, trends, and response process beside it.
| Module | Typical data | Design priority |
|---|---|---|
| Incident situation | Severity, type, location, time, and status | Help commanders assess current seriousness quickly. |
| Map points | Risk areas, resource locations, teams, vehicles, and monitoring points | Make icons, colors, and levels clear. |
| Resource dispatch | Personnel, vehicles, materials, and team status | Show available resources, distance, and dispatch state. |
| Response process | Response steps, owners, and completion times | Show closure progress and support later review. |
| Risk trends | Monitoring data, alerts, and changes over time | Help assess whether risk is growing or easing. |
An emergency command platform must explain business state. Colors, icons, motion, and 3D should help judge incidents, dispatch resources, and track response. Decorative effects must not bury essential data.
Yes. A project can validate page structure with de-identified data, Excel, admin entry, or static APIs, then connect live business systems in stages.
No. If the core work is incident lists, resource dispatch, and response, a 2D map can meet the need. Use 3D where it improves spatial understanding or supports the presentation scenario.
Before publication, remove customer names, accounts, real coordinates, sensitive measures, and confidential business details. Keep only the scenario and module explanation.
Related case:Emergency management visualization case (Chinese). Related solution:Emergency command center visualization solution (Chinese). Related services:Data visualization dashboards (Chinese), Software development (Chinese).