Fourteen Green-Factory Assessment Indicators: How to Prepare Definitions and Evidence
Summary: The annual green-factory assessment requirements from China’s Ministry of Industry and Information Technology organize green factories into five top-level dimensions: low-carbon energy, resource efficiency, cleaner production, greener products and efficient land use. They include 14 indicators totaling 100 points. Companies need more than final numbers: prepare calculation boundaries, source data, benchmarks and traceable evidence.
Start With the Five Dimensions and Their Weights
| Top-level dimension | Weight | Number of indicators | Main focus |
|---|---|---|---|
| Low-carbon energy | 30% | 4 | Energy intensity, carbon intensity, renewables and the energy-and-carbon platform |
| Resource efficiency | 30% | 4 | Materials, water withdrawal, water reuse and use of general industrial solid waste |
| Cleaner production | 16% | 3 | Advanced processes and equipment, green-upgrade investment and pollutant intensity |
| Greener products | 16% | 2 | Green product design and product carbon footprint |
| Efficient land use | 8% | 1 | Production capacity or output value per unit of land |
What Data Does Each of the 14 Indicators Need?
| No. | Indicator | Points | Type | Data to Prepare First |
|---|---|---|---|---|
| 1 | Energy-consumption intensity | 8 | Lower is better; quantitative | Total energy use, key product output, industrial output value and energy-conversion rules |
| 2 | Carbon-emissions intensity | 8 | Lower is better; quantitative | Activity data, emission factors, product output or value, accounting boundary |
| 3 | Renewable-energy utilization rate | 8 | Higher is better; quantitative | Self-generated energy such as solar, green electricity or certificates, total energy use and meter records |
| 4 | Number of compliant energy-and-carbon platform functions | 6 | Higher is better; quantitative | Feature inventory, operational screenshots, calculation rules, APIs and usage records |
| 5 | Raw-material consumption intensity | 8 | Lower is better; quantitative | Major material consumption, product output or value, loss and return records |
| 6 | Water-withdrawal intensity | 8 | Lower is better; quantitative | Water withdrawal, product output or value, water meters and supplier bills |
| 7 | Industrial-water reuse rate | 8 | Higher is better; quantitative | Freshwater volume, reused water volume, recovery-system flow and reporting boundary |
| 8 | Utilization rate of general industrial solid waste | 6 | Higher is better; quantitative | Waste generated and utilized, transfer register and disposal vouchers |
| 9 | Advanced production processes and equipment | 6 | Higher is better; qualitative | Process description, equipment register, recommended-catalogue fit and upgrade evidence |
| 10 | Share of investment in green low-carbon upgrades | 4 | Higher is better; quantitative | Project investment over three years, contracts, invoices, acceptance materials and total output value |
| 11 | Intensity of major pollutant generation or discharge | 6 | Lower is better; quantitative | Wastewater, exhaust gas and major pollutants, product output or value, monitoring reports |
| 12 | Green product design | 8 | Higher is better; qualitative | Lifecycle environmental-factor identification, design verification and improvement records |
| 13 | Product carbon footprint | 8 | Higher is better; qualitative | Main product categories, footprint boundary, activity data, factors and reports |
| 14 | Land productivity | 8 | Higher is better; quantitative | Plant land area, capacity, product output or value and area definition |
Do Not Treat the 100-Point Table as an Automatic Scorer
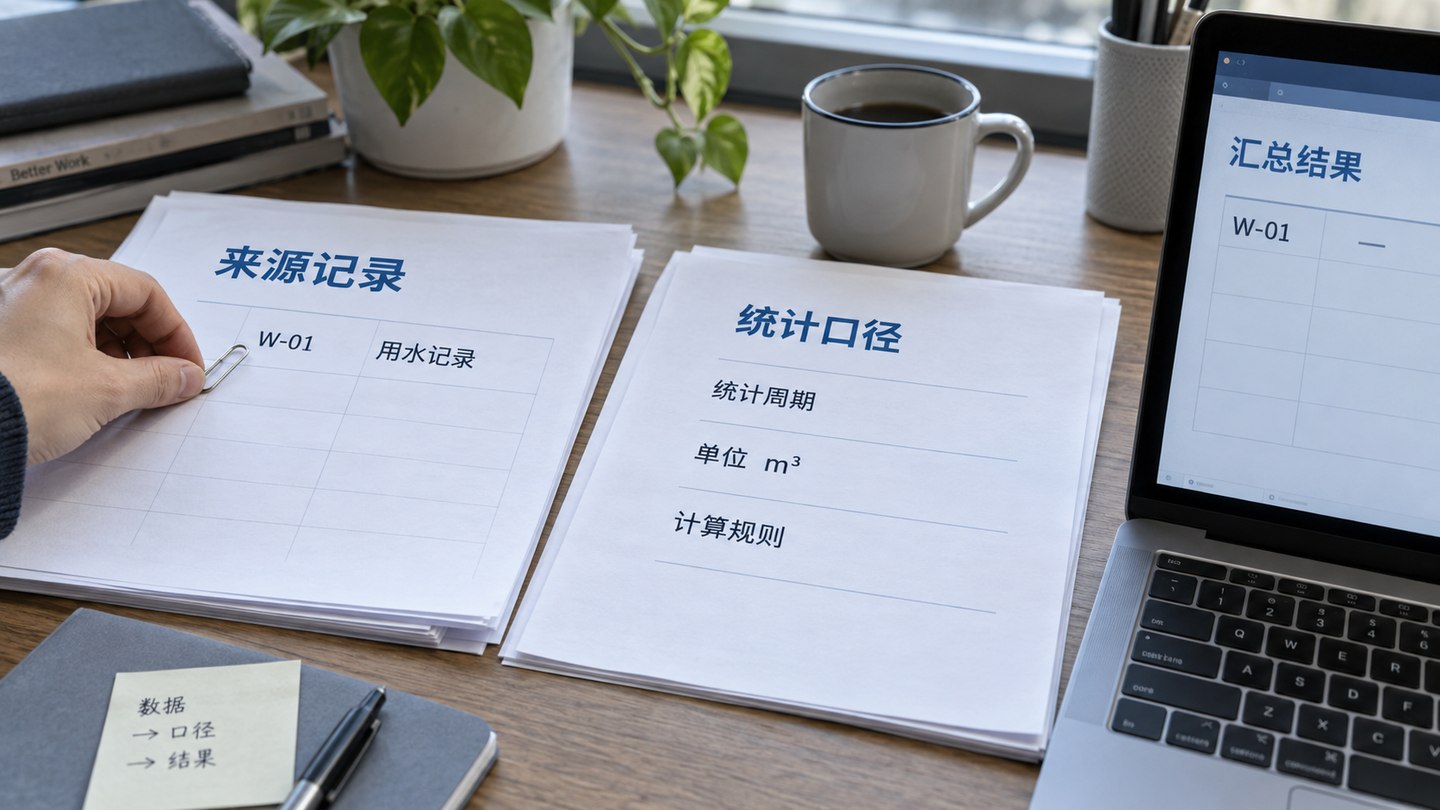
The points help identify preparation priorities, but leading and baseline values generally need to be compared with advanced and average sector performance, mandatory energy limits, industrial water-use quotas and local or platform definitions. Results are not directly comparable when organizational boundaries, product units, value definitions or reporting periods differ.
Keep four items beside every calculated value: the formula, raw data file, applicable benchmark and reviewer or owner. This makes it possible to explain a number during local review, annual reassessment or system changes instead of retaining only a final result.
Which Departments Usually Contribute to the 14 Indicators?
- Energy and equipment: Meters, equipment operation, efficiency benchmarks, energy balance and upgrade projects.
- Production and quality: Product output, accepted-product definitions, core processes, material use and green design.
- Environment and safety: Pollutants, solid waste, discharge permits, monitoring reports and compliance records.
- Finance and procurement: Energy bills, materials, project investment, green electricity or certificates and industrial output value.
- Research and supply chain: Lifecycle design, product footprints, supplier data and product classification.
- Administration or assets: Plant land, buildings, organizational boundary, licenses and evidence archive.
What Must a Data Platform Retain, Not Merely Display?
A green-factory platform should retain at least data origin, reporting period, unit, calculation rule, version, responsible department, evidence file and change history. A dashboard can show trends and exceptions, but the backend must support recalculation and traceability for annual self-assessment and ongoing management.
Indicator four directly concerns the twelve business functions of an energy-and-carbon management platform. A company need not build every function at once; first compare existing systems, interfaces and real use cases to identify gaps.
Download the 14-Indicator Data Matrix
We have prepared a green-factory 14-indicator data matrix with dimensions, weights, indicator types, points, suggested definitions, sources, responsible departments, evidence, benchmark bases and gap-record fields. It can support cross-department review before a project begins.
Policy and Source Materials
- MIIT Notice on Recommending Green Factories in 2025
- Annual MIIT Green-Factory Assessment Requirements Annex
- National Public Standards Information Platform: GB/T 36132-2025, General Principles for Green Factory Assessment
Annual forms, priority sectors and platform fields may change. Use the current notice and management platform for formal reporting.
Frequently Asked Questions
What is the total score for the 14 green-factory indicators?
Under the current annual requirements cited here, the 14 indicators total 100 points across low-carbon energy, resource efficiency, cleaner production, greener products and efficient land use.
Can companies directly copy the industry-average values in a table?
No. Verify leading values, baselines and formulas against the company’s industry, principal products, applicable standards, platform requirements and current notice.
Do all 14 indicators come from the energy team?
No. They usually involve energy, production, finance, environment, R&D, quality, procurement, equipment and administration. Agree on the organizational boundary and reporting period.
Can a data platform automatically issue a green-factory assessment result?
No. A platform can collect, calculate, retain and display indicator data. Conclusions remain subject to the competent authority, management platform and applicable current rules.
Continue Reading
Continue with national, provincial and municipal development paths, national green-factory data preparation, the twelve energy-and-carbon platform functions and the distinction between green and zero-carbon factories.