How a Liquid-Cooling Monitoring Page Supports Alarm Investigation: Link Loops, Equipment and Points
When building or updating a liquid-cooling monitoring page, make one alarm traceable to its loop, equipment and measurement point. Check data validity and related states within the same time window, and record what is known and what still needs investigation. This lets duty staff hand maintainers a clear account of “what changed, and where.” This article concerns how a monitoring interface supports review and documentation; equipment operations, process thresholds and interlock responses must follow site procedures and professional judgment.
On this page7 sections
Start with one alarm and fix the loop, point and time
Do not start by overlaying every temperature and pressure curve in the facility. When opening an alarm, keep its source system, original event ID, occurrence time, associated equipment, measurement point and loop. If one device connects to several loops, identify the side and connection location where the alarm occurred; do not merge events merely because equipment names match.
The page can show both the value at alarm time and the current value, with separate timestamps. A value that has since recovered does not mean nothing was wrong. A stale current value does not prove the equipment remained in the same state. If loop relationships change, retain their effective dates so historical events resolve to the equipment relationship that existed at the time.
If you are still inventorying data supplied by DCIM, environmental monitoring, BMS and equipment controllers, start with the DCIM and environmental monitoring integration checklist to define system responsibilities before designing this single-loop review path.
Map cooling equipment, loops and connection points separately
A loop is neither the entire equipment room nor a single pump. Start with confirmed piping diagrams and equipment point lists to show which circulation path each device belongs to and where each point sits. Equipment, loop and point names can appear together, but retain stable IDs for each so a jump from the alarm list stays on the same objects.
The DMTF Redfish for Liquid Cooling Equipment, DSP2064 version 1.1.0 explains CoolingUnit, CoolingLoop and CoolantConnector separately in sections 4.2–4.4: cooling equipment, circulation loops and supply/return connections have different modeling responsibilities. This informational white paper was published on 2025-02-05. We use it here to explain the object distinction; it does not require a project to adopt Redfish or imply that the case below uses the protocol.
Scroll the table horizontally to see the full comparison.
| Object to distinguish | Relationship to retain | Question the page answers |
|---|---|---|
| Cooling equipment | Equipment ID, type, operating state and linked loops | Which pump, heat-dissipation module or other device is being viewed? |
| Circulation loop | Loop ID, connected equipment, flow direction and relationship version | Which supply/return path is under review, without mixing in another loop? |
| Connection point | Parent device and loop, supply/return designation | Which side supplied the pressure or temperature, rather than just “inlet temperature”? |
| Measurement point and alarm | Point ID, unit, capture time, validity and original event ID | Can the exception be traced to source data, with usable time and state? |
The table suggests how to organize pages and project records; it is not a mandatory DMTF delivery requirement. If suppliers already have object codes, map them instead of renumbering every device for a new interface.
Distinguish unavailable data from process-limit breaches
“Pressure sensor failure” and “high pressure” must remain different event types. The first means the measurement may be unavailable; the second should follow a confirmed point and alarm rule. Both may occur together. Keep the source, time and original state instead of merging them into one vague red indicator to lower the alert count.
Scroll the table horizontally to see the full comparison.
| Information received by the page | How to display it | Evidence to check next |
|---|---|---|
| Communication outage or stale data | Mark outage/staleness; retain the last valid value and its timestamp. | Source communication state, capture time and recovery record. |
| Point failure or invalid reading | Show quality state; do not use an invalid value to imply normal current operation. | Fault codes and point definitions from the device or acquisition system. |
| Process value exceeds a limit | Show triggering value, unit, rule source, duration and recovery state. | Valid readings from the same point, rule version and original event. |
| Equipment state differs from feedback | Keep operating state, command state and feedback state separate. | Field definitions and update times; “running” does not replace every feedback signal. |
Equipment, acquisition and operations owners must confirm what counts as stale and which rules trigger a limit alarm. The front end should not apply one temperature, pressure or delay threshold to every loop. For outage, timestamp and quality-state checks, see the industrial real-time data integration guide.
Follow one loop and keep a reviewable exception record
Use fictional loop “L-A” and point “T-A” to explain the page path; these are not real IDs or operating events from the case. Suppose T-A triggers a temperature alarm. The review sequence could be:
- Locate the event: Open L-A from the alarm detail, highlight T-A's equipment and connection point, and retain the source system and event ID.
- Set the observation window: Review an agreed interval before and after the event; retain missing, delayed and invalid markers on the curves.
- Check related states: In the same time window, review the pump, heat-dissipation module and related points for which L-A has data. Show if supply and return readings were captured at different times.
- Record knowns and unknowns: Document changes observed, missing data and objects requiring an on-site check. Curves changing together are clues, not proof of a fault cause.
- Continue event tracking: Link maintenance records, the person who confirmed them and later observations. Keep alarm recovery separate from case closure and preserve the original event.
If adjacent points or equipment feedback are unavailable, show them as missing items rather than inventing changes to fill a supposed operating chain. The record then explains what was checked, what evidence exists and what remains unknown, so the next shift or supplier can continue.
What the real liquid-cooling interface lets you observe
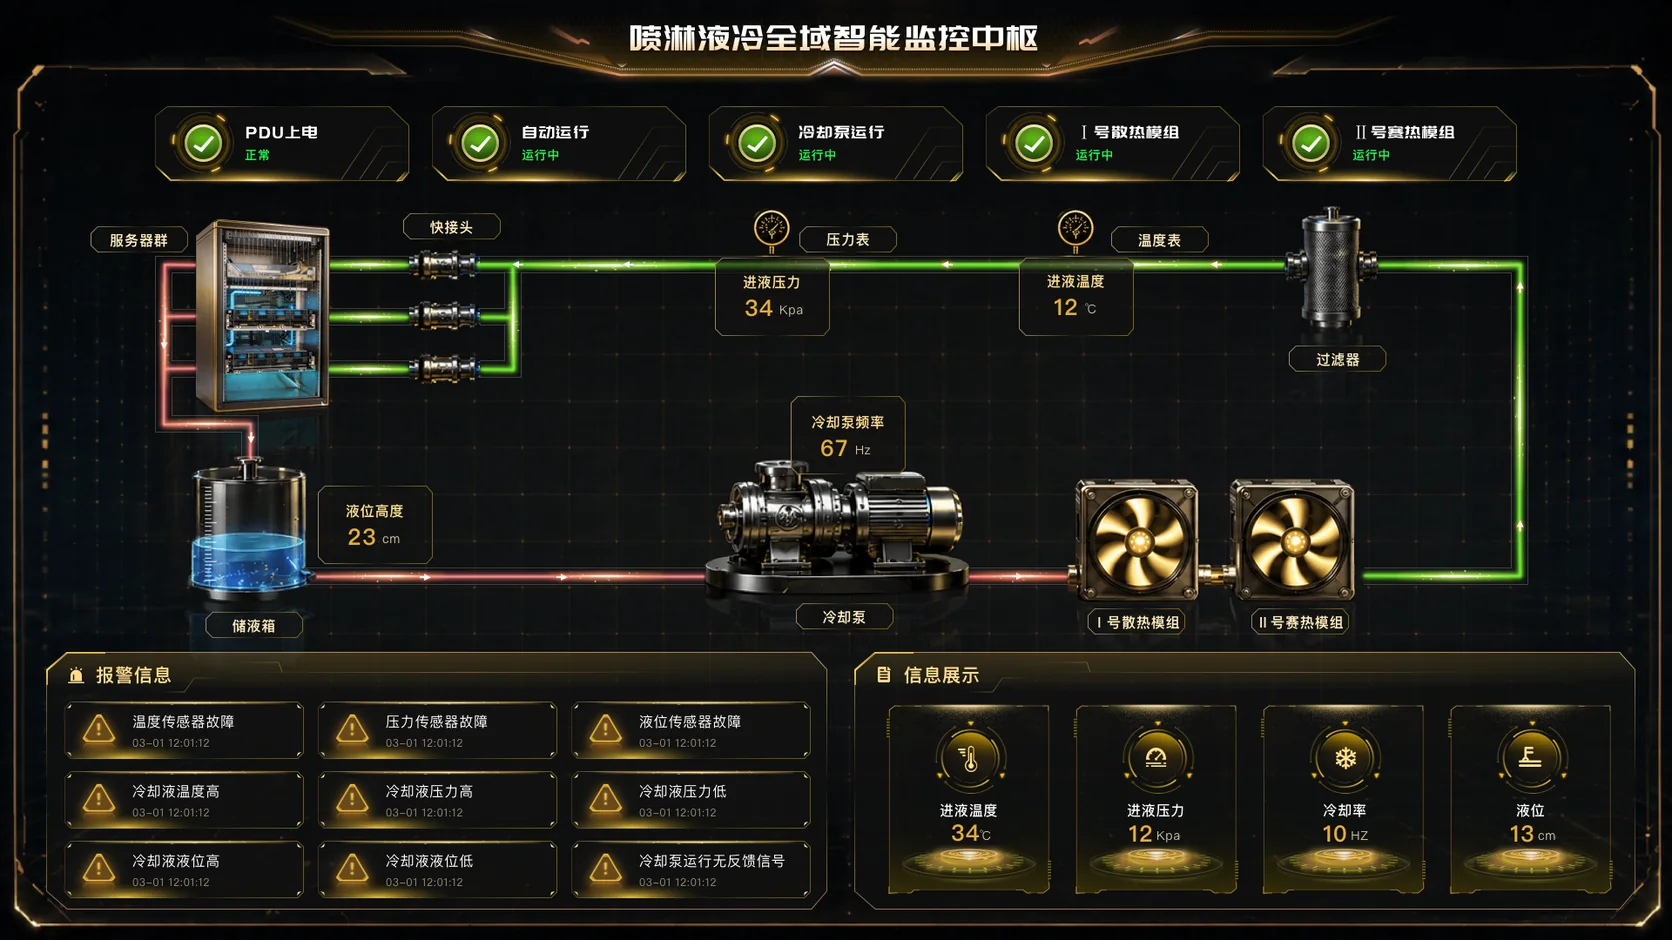
Data Center Liquid-Cooling Smart Monitoring shows the process overview. The image includes equipment relationships, process measures, top status cards and an alarm area, making it useful for discussing a unified review entry point. Values and states in the image are sample or de-identified content. They cannot be used to recalculate actual operation or assess controls, interlocks or energy savings.
This article's event location, historical relationships, time windows and review records are design methods based on the visible interface evidence. Include them in actual development only after checking available data and user needs.
Separate page development, data provision and equipment response
A liquid-cooling view can sit on top of existing DCIM, BMS, environmental monitoring or equipment systems. Suppliers and operations staff confirm loop relationships, point meanings, alarm rules and on-site response. Acquisition or source-system owners provide authorized data and exception states. Page development connects objects, data, events and records. Decide separately whether a control interface is in scope; a pump or switch drawn on the screen does not imply remote operation.
Before discussing a project, prepare one piping diagram, a sample set of equipment and points, one de-identified alarm with surrounding data, and the hardest question to investigate in the current interface. These can define deliverables such as a loop-to-point map, page prototype, state definitions, integration scope and representative event test record. The exact files, system changes and on-site work depend on project scope.
For the overall platform scope, see the Data Center Digital Twin Solution; for design and development capabilities, see Digital Twin Services and Data Visualization Development Services.
Other equipment systems with similar loop, point and exception-linking needs can also be evaluated using their actual materials; this method is not limited to liquid-cooling rooms.
Frequently asked questions
If we already have DCIM, must we rebuild the entire liquid-cooling monitoring system?
Not necessarily. First check whether the existing system exposes loops, connection points, point quality and alarm records. If the main gap is that this information is scattered, assess a unified view and linking features while retaining the source system's data and control responsibilities.
Can a page diagnose equipment failure as soon as it sees high temperature or low pressure?
Not from one value alone. Check loop location, data validity, the event period and related states first, then let professionals judge using on-site information. The page presents evidence; it does not issue equipment-operation conclusions by itself.
If we have only a process diagram and a few points, what can we build first?
Use clearly marked samples to validate loop navigation, exception states and record paths, and list missing points and who must provide them. Judge live operational capability only after real data and agreed tests are available.