Photovoltaic Power Station Operations Dashboard Solution
Explore multi-site overviews, inverter strings, weather, alerts, work orders and operations-analysis modules.
Summary: A photovoltaic operations dashboard usually moves from a multi-site overview to individual sites, arrays, inverters and strings, connecting power, generation, weather, equipment status, fault alerts and work orders. Keep the management overview separate from the operator's live view, and show the time, unit, source and detail path for each metric.
A renewable-energy control-center screen can show site distribution, installed capacity, current power, today's generation, plan completion, online rate, pending alerts and work orders. Maps and rankings are entry points; selecting a site should reveal abnormal equipment, affected power and response progress.
Typical metrics include current power, daily/monthly/annual generation, equivalent full-load hours, plan completion and comparison with the same period in prior years. Do not mix time granularities, metering points or backfill methods. Show the data cutoff time and explain communication outages or backfilled values.
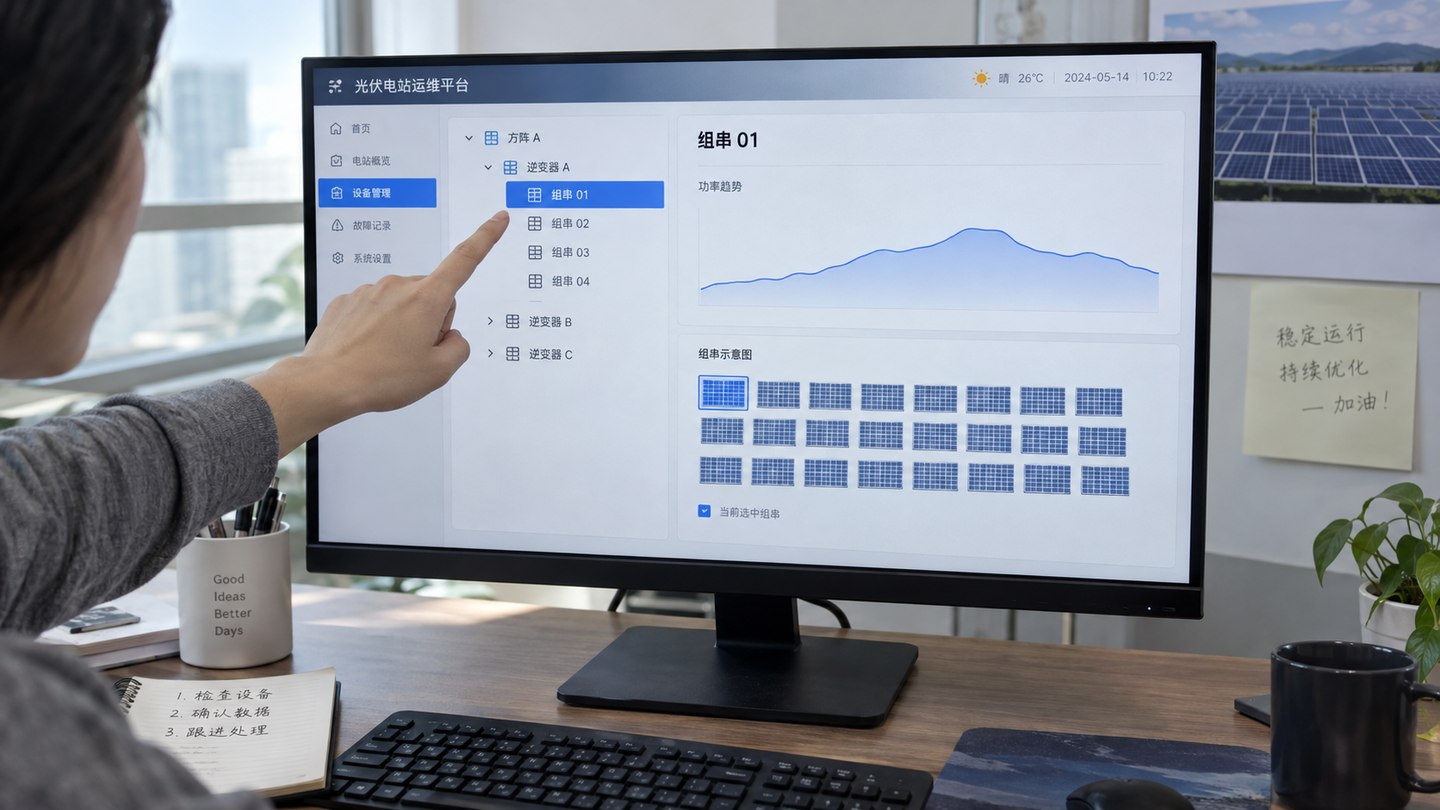
An inverter view can show operating state, key DC and AC parameters, efficiency, temperature, faults and daily generation. To locate underperformance or a string anomaly, drill from array to inverter to string and compare equipment model, capacity and irradiance conditions.
Irradiance, ambient temperature, module temperature, wind speed and weather help explain power changes. Performance-ratio and other efficiency measures require consistent irradiance sources, equipment capacity, time windows and treatment of downtime and curtailment. When data is insufficient, show the trend without asserting a fault cause.
An alert page should show site, equipment, severity, onset, duration, acknowledgement, impact and related work order. Mark duplicate alerts, communication outages and maintenance states separately so a large alert count does not obscure what needs action.
Review alert response time, work-order closure, recurring faults, equipment availability, plan execution, estimated generation loss and spare-parts use. Generation-loss and revenue figures must show the method and identify estimates; they do not replace formal settlement.
Generation below plan does not automatically mean equipment failure. First check irradiance, ambient temperature and weather-station health; then examine curtailment or dispatch plans, site communications, inverter availability, string deviations, cleaning and maintenance records. Use one time window to distinguish resource changes, grid constraints, missing data and equipment faults.
For PR and other efficiency measures, state the capacity boundary, irradiance source, reporting period, missing-data treatment and inclusion of downtime or curtailment. Sites with different module types, weather or calculation rules should not be judged by one ranking. Let users inspect the calculation conditions and version, then return to original irradiance, power and generation data.
Maintain the relationship among site, area, box transformer, inverter, combiner equipment and string, including effective dates for expansion, replacement and string changes. Live power, minute trends, daily totals and settlement generation use different time granularities. When cumulative readings reset or are backfilled, retain revision records rather than joining incompatible values into one continuous curve.
Gather site and equipment registers, topology, installed capacity, inverter and string measurements, weather-station data, alert dictionary, work-order workflow, plans, metering definitions and roles. At acceptance, check power direction, units, cumulative readings, offline states, equipment drill-down, alert links, backfill logic and display on the target terminal.
First use the photovoltaic solution to define site and equipment layers, then compare energy-management and data-acceptance requirements.
Explore multi-site overviews, inverter strings, weather, alerts, work orders and operations-analysis modules.
Define energy consumption, equipment status, exceptions and operations-review metrics.
Check data, interactions, performance, permissions and handover materials.
Set boundaries for control centers, control-system links, sensitive data and action logs.