What Data Should a Smart Port Logistics Dispatch Dashboard Show?
Summary: A smart port logistics dashboard should not place every port dataset on a single screen. Build a shared view around vessels, berths, vehicles, yards, cargo, routes, work progress, and incidents so teams can dispatch resources and review outcomes.
The dashboard should first answer three questions: Where are resources now? How far has work progressed? Which exceptions need attention?
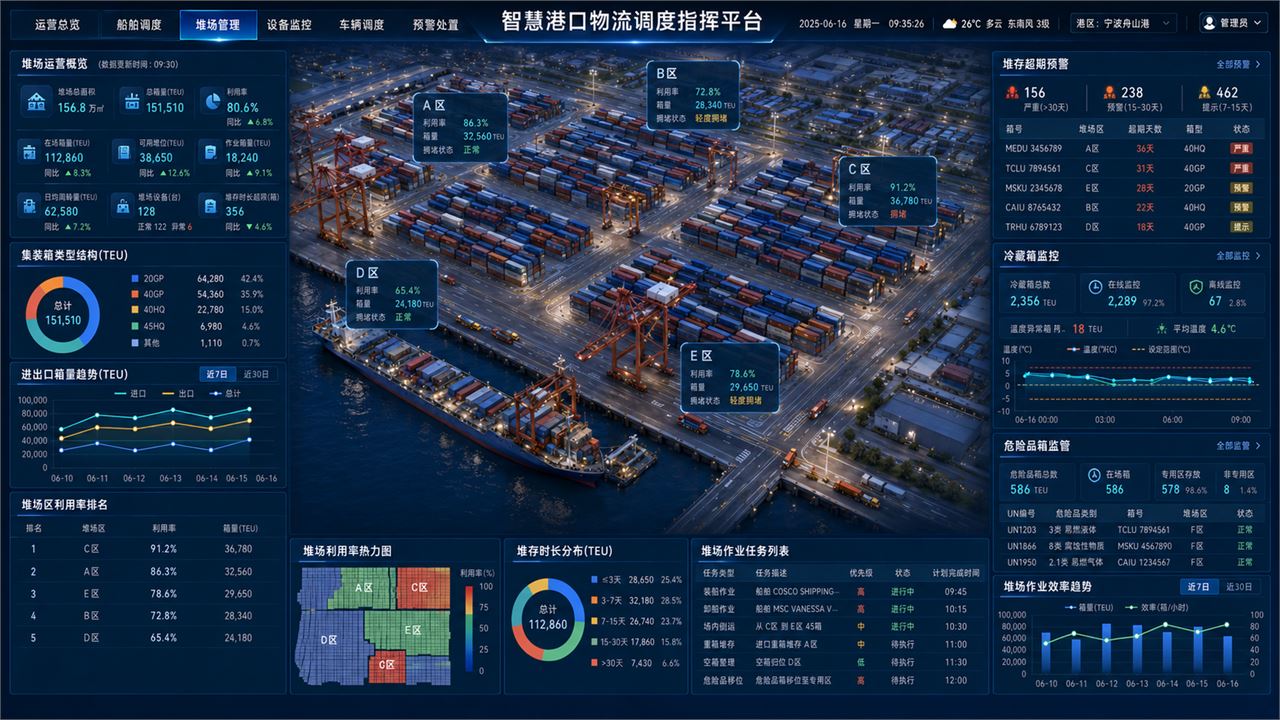
A de-identified port logistics case interface showing dispatch activity, vehicles and vessels, yard resources, and logistics data.
1. Port resource data
Dispatch starts with resource use: berths, yards, gates, warehouses, handling equipment, vehicles, and staff. Resource data lets the dashboard reveal bottlenecks, spare capacity, and where work needs to move.
2. Vessels and berths
Vessel fields commonly include name, voyage, planned and actual berthing time, berth, work status, loading or unloading volume, and departure plan. For berths, show utilization, wait time, work progress, and reasons for exceptions.
3. Vehicles, routes, and gates
Vehicle dispatch needs location, queue length, entry and exit records, route status, task status, and wait time. With positioning data, show distribution on a map or site plan. Without it, start with task lists, gate records, and status panels.
Data type
Common fields
Page purpose
Vessel data
Vessel name, voyage, berthing time, work status, departure plan
Area, storage slot, inventory, utilization, work state
Yard status, cargo distribution, storage dispatch
Cargo data
Cargo type, quantity, order, waybill, destination
Throughput, cargo flow, operational review
Incident data
Event type, severity, location, owner, handling status
Risk alerts, dispatch response, outcome reporting
4. Yards and cargo
Yard data should answer “Where is the cargo, how much space does it occupy, and where will it go next?” Show area utilization, slot state, cargo type, quantity on hand, inbound and outbound plans, and handling efficiency.
5. Work progress and exceptions
A dispatch dashboard also needs task progress and incidents: completion rate, handling progress, vehicle waits, equipment failures, route congestion, weather impacts, and safety events. Record severity, location, owner, response state, and closure time so issues do not end at an alert.
Page design suggestions
Organize the dashboard into overview, resources, work, exceptions, and statistics. The overview supports a quick situational read; resources covers vessels, berths, vehicles, and yards; work tracks tasks; exceptions shows response outcomes; statistics supports efficiency reviews.
Keep detail off the first screen; prioritize key states and exceptions there.
Use maps, site plans, and lists together so task status does not disappear behind a location-only view.
Align metric definitions in advance, including throughput, completion rate, wait time, and incident closure rate.
For long-term use, provide backend maintenance, permissions, and data import or API integration.
What to prepare before kickoff
Port site plan and inventories of berths, yards, routes, and critical resources.
Vessel schedules, vehicle tasks, cargo manifests, warehouse data, and historical work records.
Screenshots of current systems, API documents, database fields, or sample Excel sheets.
Target screen size, use case, account permissions, and deployment environment.
Priority dispatch metrics and incident-handling workflows.
Frequently asked questions
Does a port logistics dashboard need real-time data?
Not always. Business-system data, databases, Excel, or simulated data can support early page validation. For live dispatch, add real-time or near-real-time vehicle positions, vessel plans, yard states, and incidents in phases.
Does a port visualization platform need a map?
A map or site plan makes routes, berths, yards, and vehicle locations clearer. If the purpose is only a business report, metrics, trends, and lists may be enough initially.
How does a dispatch dashboard differ from a backend system?
A dispatch dashboard emphasizes status, trends, and command coordination. A backend system handles data maintenance, account permissions, work orders, and details. Long-running projects usually need both to work together.