How to Plan an ESG and Carbon Data Dashboard
Summary: An ESG and carbon data dashboard should begin with reporting boundaries, metric definitions, data sources, accountable teams, supporting evidence, and version rules—not charts. First establish whether data can be obtained, recalculated, and traced. Then decide how to build pages, interfaces, permissions, and update workflows.
Project note: An ESG dashboard is an interface for data management and analysis. It is not itself a sustainability report, rating, or assurance engagement. Its value is in giving metrics clear boundaries, data traceable sources, calculations controlled versions, and conclusions supporting evidence.
View the ESG and Sustainability Data Preparation Checklist (Chinese), or download the CSV template.
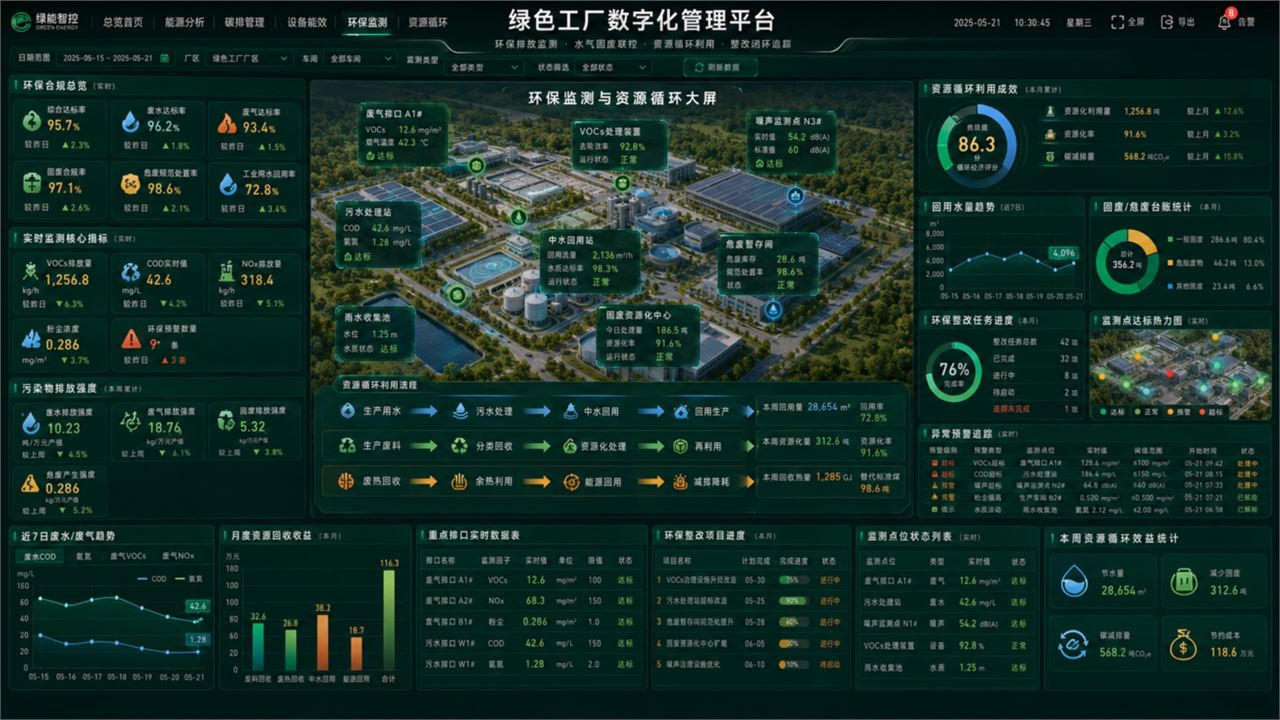
First, distinguish three deliverables that are easy to confuse
| Deliverable | Primary purpose | What a system can support | What it cannot directly replace |
|---|---|---|---|
| ESG data dashboard | Ongoing management of metrics, trends, responsibilities, and data quality | Collection, calculation, traceability, permissions, reminders, and display | Determining applicable rules and final disclosure conclusions |
| Sustainability report | Structured disclosure under an applicable framework | Working papers, metrics, versions, and an evidence index | Responsibility for preparing the report and management approval |
| Rating or assurance | Assessment or verification by the relevant organization using its methodology | Preparation of reviewable data and process records | Rating results, audit opinions, or assurance conclusions |
Step 1: Confirm applicability and reporting boundaries
The same company may need data for internal management, group reporting, customer questionnaires, supply-chain requests, or public disclosure. At kickoff, record the purpose, reporting entity, organizational boundary, reporting period, base period, currencies and units, and frameworks or internal policies being applied. Without these premises, even “carbon emissions” or “total employees” can have different answers.
IFRS S1 addresses sustainability-related risks and opportunities that could affect an entity's prospects; IFRS S2 focuses on climate-related disclosures. The Shanghai Stock Exchange's Self-Regulatory Guideline No. 14—Sustainability Report (Trial) has its own scope of application. Each company must first determine what applies to it rather than copy one framework's fields into every project.
Step 2: Build an environmental, social, and governance data catalog
| Topic | Data to organize first | Common sources | Key controls |
|---|---|---|---|
| Environment (E) | Energy, greenhouse gases, water, waste, pollutants, resource use, and emissions-reduction projects | Utility bills, metering systems, production systems, environmental registers, and supplier information | Organizational boundary, unit conversions, factor versions, and source documents |
| Social (S) | Workforce composition, safety, training, suppliers, customers, and data privacy matters | HR, EHS, procurement, customer service, and security systems | Privacy, de-identification, aggregation level, and incident definitions |
| Governance (G) | Governance responsibilities, policies, risks and opportunities, compliance incidents, and audit trails | Policy documents, meeting minutes, risk registers, and remediation records | Permissions, approvals, versions, and audit trails |
Step 3: Make carbon data independently recalculable
For greenhouse-gas data, connect at least the organizational boundary, reporting period, activity data, units, emission factors, factor sources and versions, formulas, data sources, original evidence, and reviewer. The GHG Protocol Corporate Standard helps frame an organization-level greenhouse-gas inventory; the Scope 3 Standard covers value-chain emissions accounting and reporting. Confirm which parts to apply in light of the company's purpose and applicable requirements.
Scope 1 and Scope 2 data can often start from fuel, electricity, steam, and refrigerant records. Scope 3 spans multiple value-chain categories with uneven data maturity. First classify each category as applicable, under review, or not applicable; then check supplier data, activity data, estimation methods, and improvement plans one by one.
Step 4: Show both outcomes and data quality
- Management overview: Show priority metrics, progress toward targets, exceptions, and missing data without crowding every indicator onto one page.
- E/S/G topic pages: Break trends, composition, and details out by management responsibility and data permissions.
- Carbon emissions analysis: View totals, intensity, and reasons for change by scope, organization, region, energy source, and period.
- Data quality page: Show the shares of measured, calculated, estimated, and missing data, plus evidence completeness and overdue items.
- Emissions-reduction projects page: Record project baselines, targets, investment, progress, energy and emissions reductions, and the basis for verification.
- Permissions and audit page: Record who submits, who reviews, who may inspect details, and how exports and version changes are tracked.
Recommended implementation sequence
- Confirm the use case, applicable frameworks, organizational boundary, and reporting period.
- Build the data catalog with definitions, sources, owners, frequency, and sensitivity levels.
- Select a few priority metrics and recalculate sample results, checking units, factors, and evidence chains.
- Design interfaces, manual submissions, approvals, version control, and attachment retention.
- Set role permissions, then build overview, topic, quality, and project pages.
- Review missing data, estimates, outliers, and methodology versions on a regular schedule.
Public reference materials
- IFRS Foundation: IFRS S1 General Requirements
- IFRS Foundation: IFRS S2 Climate-related Disclosures
- GHG Protocol Corporate Standard and Scope 3 Standard
- Shanghai Stock Exchange: Self-Regulatory Guideline No. 14—Sustainability Report (Trial)
These sources help explain common data topics and management structures. They do not determine any company's applicability, compliance, rating, or assurance outcome.
Frequently asked questions
Is an ESG data dashboard the same as an ESG report?
No. A dashboard supports ongoing management of data, definitions, evidence, and owners. A report is an internal or external document prepared against applicable rules and reporting boundaries. The system can supply data but cannot replace an applicability assessment, report preparation, or assurance.
Can the system automatically calculate all Scope 3 emissions?
That cannot be guaranteed. Scope 3 often relies on value-chain data from suppliers, procurement, transport, travel, and product use. First determine categories, boundaries, data availability, and calculation methods; then decide what can be integrated automatically and what needs manual entry or third-party data.
Can missing data simply be estimated?
Estimates may be used once their method and purpose are clear, but label the data type, basis, applicable period, owner, and uncertainty. Distinguish them from measured data or figures backed by original documents. Whether estimates can support a particular disclosure or review depends on applicable requirements.
Should all sensitive workforce data be displayed?
No. Control access to workforce, pay, health and safety, and incident information by role, organization, and purpose. Prefer aggregated, de-identified results on public or large-format screens, and retain access and export records.
Does finishing this checklist mean disclosure requirements are met?
No. The checklist helps find gaps in data, definitions, evidence, and ownership. It is not a compliance conclusion, rating, audit opinion, or assurance report. The company must still determine the current requirements applicable to its entity, listing venue, and industry.