Which Data Sources Does a Flower Greenhouse Visualization Cloud Platform Need?
Summary: The platform should do more than chart temperature and humidity. It should bring environmental monitoring, equipment operation, video, alarms, crop batches and environmental-control actions into one management view.
First Define the Problem the Platform Must Solve
Typical goals include checking conditions in real time, detecting unusual changes, reducing manual inspections, supporting growing decisions and viewing multiple greenhouse zones together. Priorities vary by goal. Management reporting needs trends, comparisons and alarm statistics; daily operations need live values, device status and handling records.
Environmental Monitoring Is the Foundation
Typical fields include air temperature and humidity, light intensity, carbon dioxide, soil temperature and moisture, soil EC and pH, the indoor/outdoor temperature difference, and historical trends. Store collection time, sensor location, device ID and threshold range so an exception can be traced to a zone, sensor and crop stage.
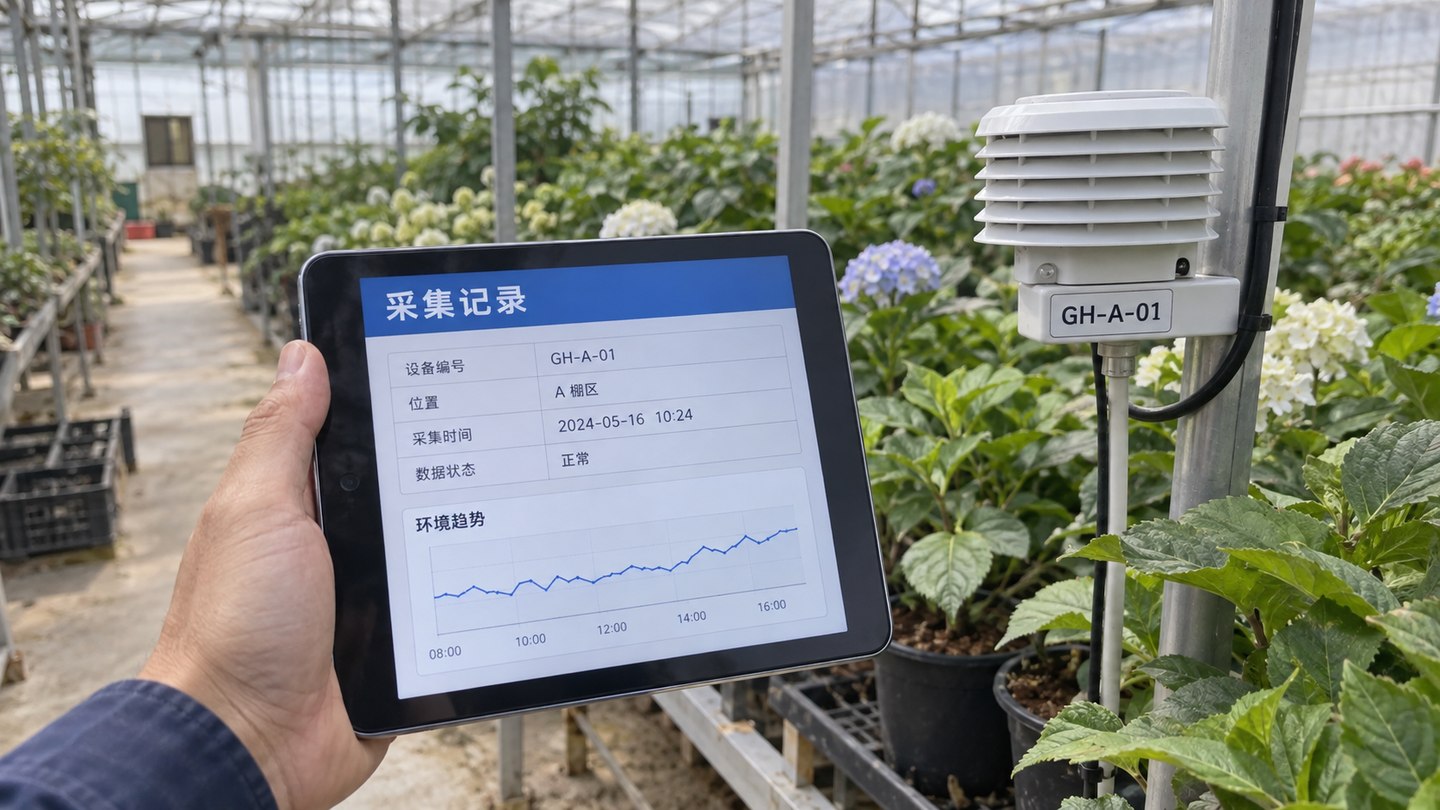
Review greenhouse readings with both zone and sensor identifiers. The same example ID appears on the sensor label and collection record, making the measurement’s source clear.
Device Status Enables Environmental Control Linkage
If intelligent control is in scope, inventory fans, cooling pads, curtains, roof vents, grow lights, sprayers, drip irrigation, fertigation units, heating and power equipment. Record control mode, last action, faults and manual overrides as well as on/off state. The page can then show status, action and outcome, not just measurements.
Connect Video and Alarm Data
Do not isolate video surveillance. Link camera position and greenhouse location with environmental exceptions and alarms. When a zone overheats, humidity becomes abnormal or a device goes offline, operators should see the alarm details, relevant live view and handling status together.
Closed-loop exceptions, work orders, review statistics
Do Not Leave Out Crop-Batch and Business Data
With only environmental and equipment data, the platform remains a monitoring system. Add flower variety, planting batch, greenhouse distribution, growth stage, expected harvest, stock, inbound and outbound movement, and sales destination where relevant. These links make it possible to relate conditions to production results and improve growing practices.
Implementation Advice
Hongshan Technology recommends starting with one greenhouse zone or one management goal. Connect environmental readings, device status and alarms first, then extend to video linkage, crop batches and operational analysis. A phased start keeps the first release manageable and helps validate data quality and page usefulness.
Frequently Asked Questions
Does a greenhouse visualization platform require sensors?
Not necessarily. Existing spreadsheets, manual inspection records and video can be connected first. If real-time environmental monitoring and automatic alerts are needed, add temperature, humidity, light, carbon dioxide and soil-moisture sensors in stages.
Can greenhouse controls be linked to a dashboard?
Yes. The dashboard can show fans, curtains, lighting, spraying and irrigation, and can support control, alerts or work-order dispatch according to permissions. Do not expose remote control without appropriate safety checks.
Does a greenhouse project need a digital twin?
Consider 3D visualization or a digital twin when the project needs greenhouse zones, device and camera locations, and environmental changes in one spatial view. For management metrics and daily reports alone, a 2D dashboard is usually lighter.