What Should a Reclaimed-Water and Thermal-Storage Digital Twin Show?
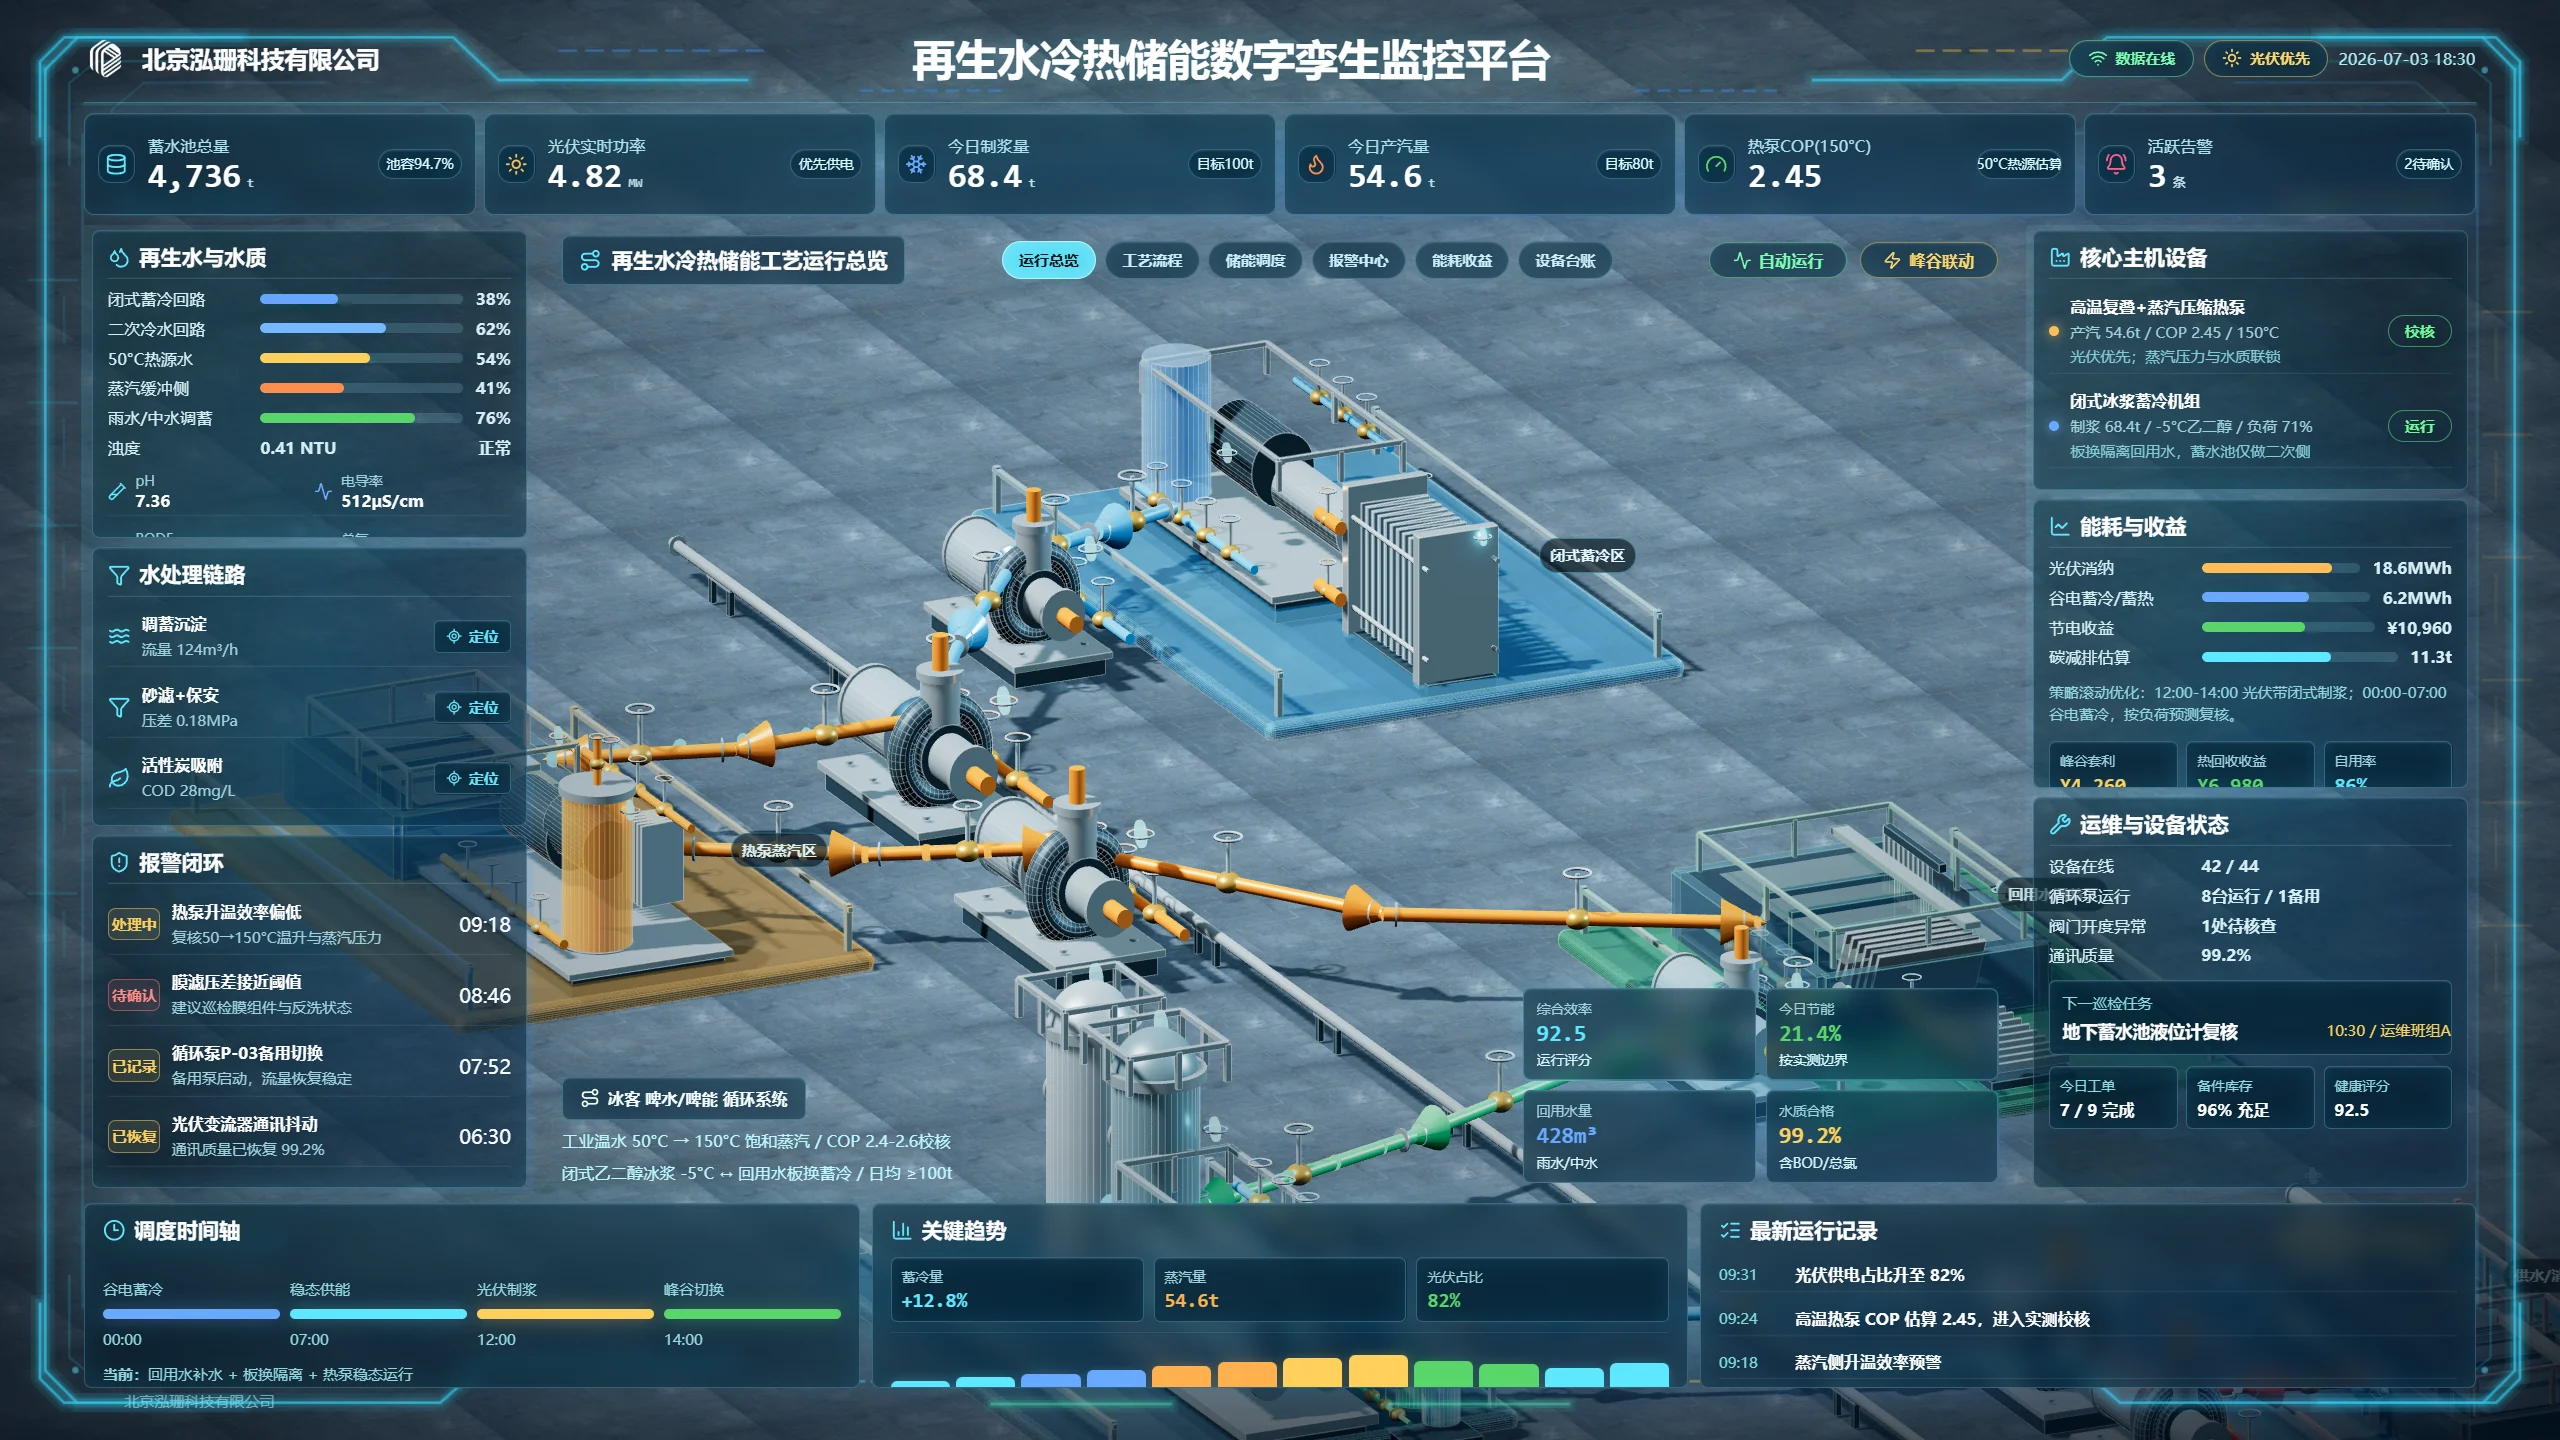
Summary: A reclaimed-water, cooling and thermal-storage digital twin should not fill the screen with equipment readings. It should bring the reclaimed-water loop, water quality, heat pumps, steam, cold storage, energy costs and benefits, alarm handling and dispatch strategy into one view for status checks, exception review and operations analysis.
It should answer four questions first: Where does the water come from? How is energy converted? Are devices stable? Does today's operating strategy make economic sense?
Project demonstration video
The monitoring-platform overview cover is above, with the original project demonstration video below. Use them to inspect page structure and operation separately.
First screen: top metrics should show whether today is normal
These screens commonly put a few vital measures at the top: reservoir volume, live photovoltaic power, today's process output, steam production, heat-pump COP and active alerts. Their purpose is not to display “lots of data” but to help duty staff judge resource headroom, current efficiency and unresolved exceptions within ten seconds.
If the project also involves time-of-use electricity tariffs, peak/off-peak coordination or photovoltaic self-consumption, show the current operating strategy on the first screen: perhaps off-peak cold storage, photovoltaic priority or steady-state steam. Management should see the reason behind an outcome, not just the outcome.
Left-hand modules: keep reclaimed water, water quality and treatment together
Unlike a conventional energy station, reclaimed water is tied directly to quality, safety and reuse efficiency, not just volume. The left side can group reclaimed water and quality, the treatment chain and alarm-handling records.
Module
Suggested fields
Purpose on the page
Reclaimed water and quality
Loop state, level, turbidity, pH, conductivity and temperature
Check quickly whether reused water is stable and available
Locate blockage or degradation in the treatment process
Alarm handling
Severity, trigger time, handling state, owner and recovery time
Prevent alarms from ending without a recorded response
If the site has PLC, SCADA or water-monitoring systems, synchronize key volume and quality fields first. If there is no common API, daily reports, Excel and duty logs can establish initial measures so the page logic can be tested.
Center scene: the digital twin should explain the process, not merely impress
The center is usually a process overview. A 2D flow diagram or 3D digital twin can show the relationships among heat-pump units, heat exchange, storage dispatch, reclaimed-water loops and the steam line. More than visual realism, the goal is to make water flow, heating/cooling energy flow and equipment status understandable at a glance.
At minimum, distinguish running, standby, fault and maintenance states for equipment.
Show flow direction, temperature range and pressure or load state on key loops.
For linked digital-twin interaction, selecting equipment should show points, alarms, trends and maintenance history.
If the project is only a presentation dashboard, start with an overview rather than a full back-end system.
Right-hand modules: equipment, costs and operations support decisions
The right side can focus on equipment decisions and business performance. In an energy-station view, it might include the state of high-temperature cascade heat pumps, plate-heat-exchanger isolation, pump groups, valves, cooling and storage equipment. It can also show steam output, COP, photovoltaic use, grid-power substitution, energy-cost savings and estimated carbon reductions.
If both operators and owners use the platform, split this side into two levels:
Equipment: unit health, online rate, load, standby state and inspection tasks.
Business: energy cost, savings, photovoltaic self-consumption, on-site use and carbon reduction.
This prevents one screen from trying to explain both machinery and business performance without doing either clearly.
Bottom modules: trends and logs make retrospective review possible
Many dashboards show only “right now,” making later analysis difficult. Reserve space for key trends, a dispatch timeline and recent operating records. Trends might show cold-storage volume, flow, photovoltaic share, steam production and efficiency; the timeline might mark off-peak charging, steady supply, photovoltaic-driven processing and peak/off-peak switching. Logs capture important events and strategy changes during the day.
For weekly and monthly reports or executive presentations, these records are more useful than live numbers alone.
What data and materials should be prepared?
Process flow diagrams, system topology, and energy-station plans or equipment layouts.
Equipment and point lists, variable names, units, refresh rates and exception thresholds.
Historical samples for reclaimed-water loops, quality tests, flow, differential pressure, level and temperature.
Operating states and alarm rules for heat pumps, steam, cold storage, photovoltaics, pumps, valves and heat exchangers.
Peak/off-peak tariffs, definitions for benefit and carbon calculations, and dispatch-strategy descriptions.
Site photos, demonstration video, operating manuals and the owner's priority KPI list.
Which additional pages are useful?
To turn a presentation dashboard into a platform for long-term use, plan at least an overview, process-flow page, equipment-detail page, alarm center, energy-cost and benefits page, and operations register. Use the overview for status, the flow page for process paths, equipment details for points, alarms for handling progress, benefits for external reporting and the register for a maintenance trail.
Frequently asked questions
Does a reclaimed-water and thermal-storage digital twin have to use 3D?
No. If the immediate goal is management reporting or duty monitoring, a 2D process diagram and status dashboard may be enough. If users need spatial equipment relationships, point location, process links and exception-handling paths, 3D or a digital-twin scene may be clearer.
Does this kind of platform need real-time data?
For on-site coordination and duty dispatch, connect live or near-live data. If the first release is for a proposal, bid demonstration or page review, historical, daily-report or simulated data can establish the first version.
Which materials are most often missing before development?
Equipment point lists, process flow diagrams, alarm rules, energy-metric definitions and dispatch-strategy notes are most commonly missing. A page can still be built, but integration and acceptance may then require repeated rework.