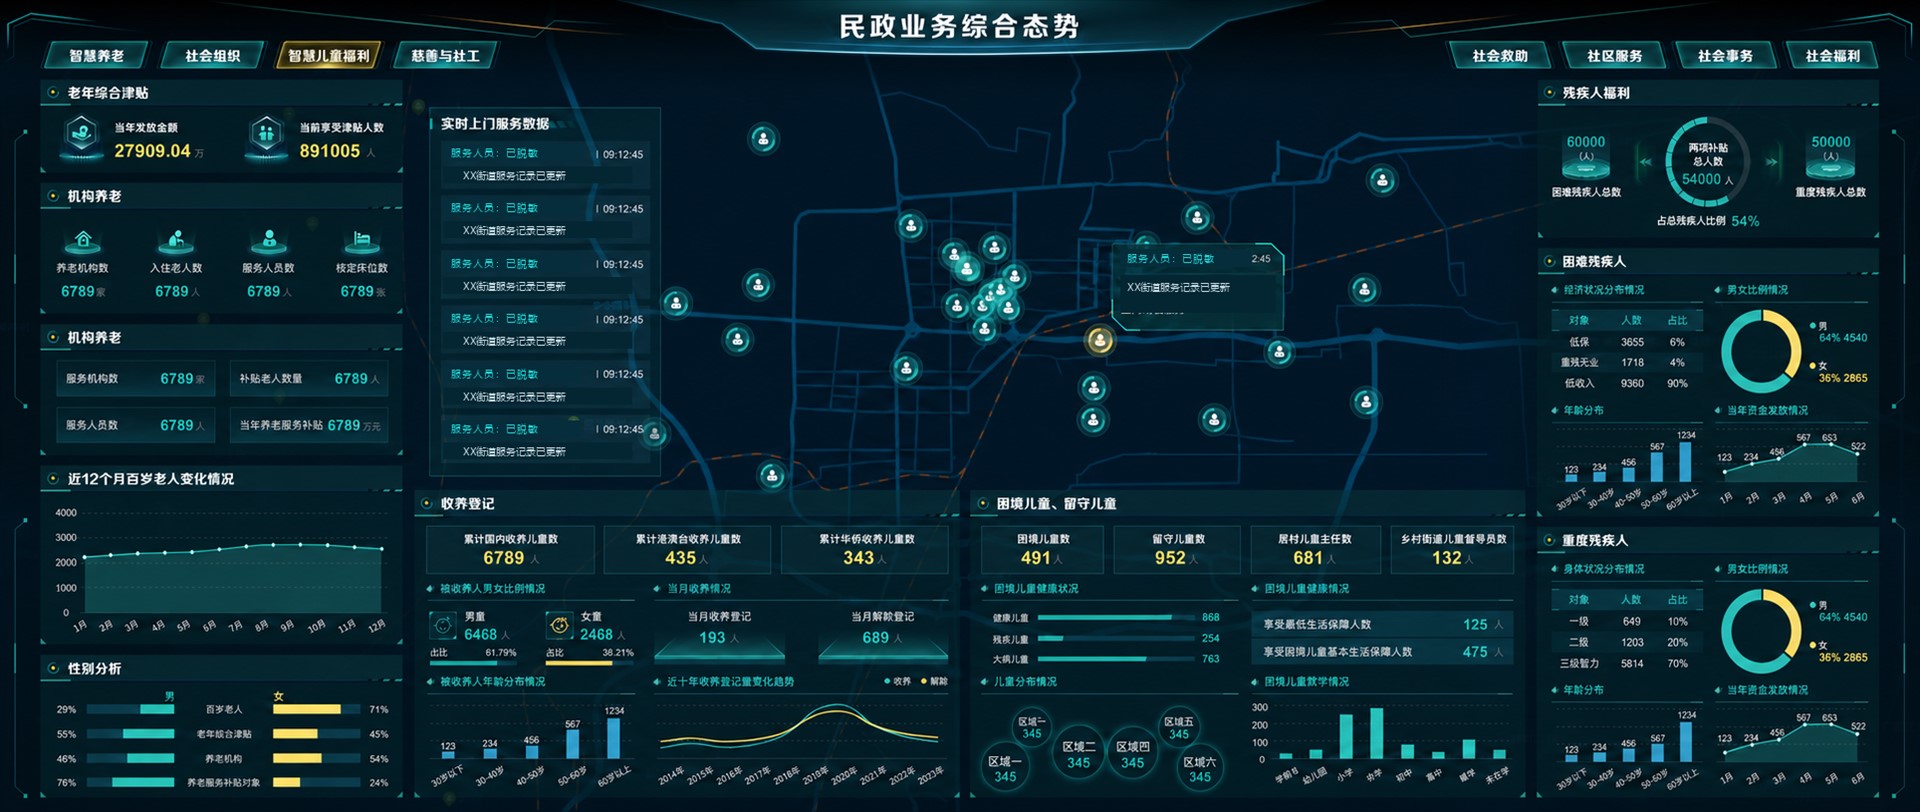
This anonymized screen uses a regional map as the center and places elderly care, child welfare, disability benefits, adoption registration and home-service activity on one ultra-wide dashboard, so a briefing can move from the overall picture to a specific service.
Industry
Civil affairs, public services and livelihood support
Page use
Overall picture, where services are, and topic briefings
What the layout emphasizes
Ultra-wide layout, regional map, indicators and service activity
Anonymized civil affairs overview. The center is a regional map and service points. The sides and bottom cover elderly care, home services, adoption, child welfare and disability benefits.
Compare coverage with where the service happens
A civil affairs briefing needs more than how many people are served. It also needs where the resources are and where recent services happened. With map points next to home-service activity, staff can compare a topic total with a place, as a lead for checking coverage and opening a topic.
Service entries8 visible topics
Main spatial viewRegional map and service points
Priority topicsElderly care, children and disability benefits
Information typesTotals, distribution, trends and service activity
What the screen shows
Civil affairs spans elderly care, child welfare, social assistance, community services, social organizations, charity and social work, and disability benefits. A combined screen needs clear entries first, then institutions, people, services, subsidies, registrations and regions at a consistent level.
The screenshot is one ultra-wide overview. The top switches topics. The center map holds place and service points. The left focuses on elderly care. The bottom holds adoption and child welfare. The right holds disability benefits. The page shows structure and visible fields. It does not by itself prove a back-office interface, a live update or a service result.
How the information is arranged
Top navigation: entries for elderly care, social organizations, child welfare, charity and social work, social assistance, community services, social affairs and social welfare.
Center map: a desensitized regional view, service points, and a highlighted popup for a selected service.
Left elderly-care topic: allowance, institutional care, a 12-month trend and sex structure.
Center activity: home-service records by time, so a point and a service process can be read together.
Bottom children’s topic: adoption registration, children in difficulty, left-behind children, health and support.
Right benefits topic: disability benefits, people in difficulty, severe disability, and age and sex.
Modules and what each one does
Module
Visible on the screenshot
Job of the area
Elderly care
Allowance, number of institutions, occupancy and beds, staff, trend and sex structure
An overview of funds, institutions, staff and the people served.
Home services
Activity list, map points, service prompts and time
Link a service process to a place, for coverage and the activity record.
Adoption registration
Types of adoption, registrations and cancellations this month, sex and age
Show the scale, structure and change of registrations together.
Child welfare
Children in difficulty, left-behind children, health, support and group distribution
A topic view of priority groups, for a total and a breakdown.
Disability benefits
People in difficulty and with severe disability, subsidies, economic status, age and sex
Arrange the topic by scale, structure and funds paid.
Regional map
Administrative areas, service points, selected-point information and topic distribution
Place institutions, people served and events, and provide a way to open detail.
Visual and interaction priorities
The map is the main line: The center keeps a large visible area. Points and popups sit on the map, so place is not only decoration.
Topics follow the group of people: Elderly care, children and disability benefits each keep a stable area, with a similar order of title, indicators, trend and structure.
Overview and activity sit side by side: Static totals answer the current scale and structure. The service list answers what is happening. The two kinds of information stay separate.
Fit the ultra-wide screen: The page spreads modules across a ratio near 64:27. Type size and chart density still need the real output resolution, how screens are joined, and the viewing distance.
Usual data sources and the access boundary
Data type
Usual source
What to confirm
Region and points
Administrative divisions, streets and communities, service institutions and GIS coordinates
Coordinate precision, boundary version, map-service rights and what may be published.
Elderly care
Institution ledger, staff, beds, subsidies and service work orders
Indicator definition, period, duplicate people, and removal of personal information.
Child welfare
Adoption registration, ledgers for children in difficulty and left-behind children, support and health summaries
Minimum fields, graded permissions, protection of sensitive groups, and export control.
Disability benefits
Person ledger, subsidy payment summary, grade and age structure
Authorization to use the data, a threshold for regional totals, and masking of sensitive fields.
Service activity
Home-service work orders, time records, service status and institution information
Update frequency, exception states, how names are shown, and how long logs are kept.
Permission, desensitization and acceptance
Authorize by role: Overview, topic analysis, person-level detail, export and administration should be authorized separately. Person-level data is not open to unrelated roles by default.
Show the minimum: Name, ID, contact, address, health and benefit status are sensitive. Use a summary, a mask, an alias, or do not show them.
Keep the definition: Each indicator needs its definition, calculation, period, source, update time and owner. Accepting the number on the screen is not enough.
Accept in layers: Interface acceptance checks layout and interaction. Data acceptance checks interfaces, sample records and exceptions. Performance acceptance is done on the real screen and network.
Where it can be extended
Civil affairs overview screen
Elderly-care service map
Child welfare topic
Disability benefits topic
Social assistance cockpit
Community service resource map
Livelihood fund summary
Government briefing and command room
Pages that can be added
Institution detail: Qualifications, beds, occupancy, staff, services, inspections and exceptions.
Home-service dispatch: Filter work orders by area, institution, service type and status, and see execution, follow-up and filing.
Child welfare topic: Under strict permission and desensitization, manage categories, support measures, service records and risk prompts.
Disability benefits topic: View summaries and exceptions by subsidy type, grade, region and payment period.
Indicator-definition back office: Maintain definitions, sources, update time, review records and the published page version.
Questions
What does the page bring together?
The screenshot shows entries for elderly care, social organizations, child welfare, charity and social work, social assistance, community services, social affairs and social welfare, and focuses on elderly care, adoption, children in difficulty and left behind, disability benefits and service points.
What data is usually connected?
Common data includes administrative areas and service points, elderly-care institutions and service ledgers, subsidy summaries, adoption, child welfare, disability benefits and home-service work orders. Fields, frequency and permission follow the actual source.
Are the numbers on the screenshot live?
No. This page explains the visible structure. Places, people and service addresses are desensitized. Numbers and times are read as the interface shows them, not as a live statistic, a policy basis or a project result.
Related services and further reading
About this case: This page is arranged from an authorized project screenshot. Specific places, people and service addresses have been removed. The public content explains the visible information structure and visual organization. Numbers and times are not current business data, and they do not replace project authorization, interface records, acceptance material or an official government release.