What does data-visualization dashboard development usually include?
It usually includes requirements, indicator review, prototype, UI, front-end development, data interfaces, joint testing, deployment, acceptance and launch maintenance.
UI design and 3D modeling can be commissioned on their own, or combined with development and data access.
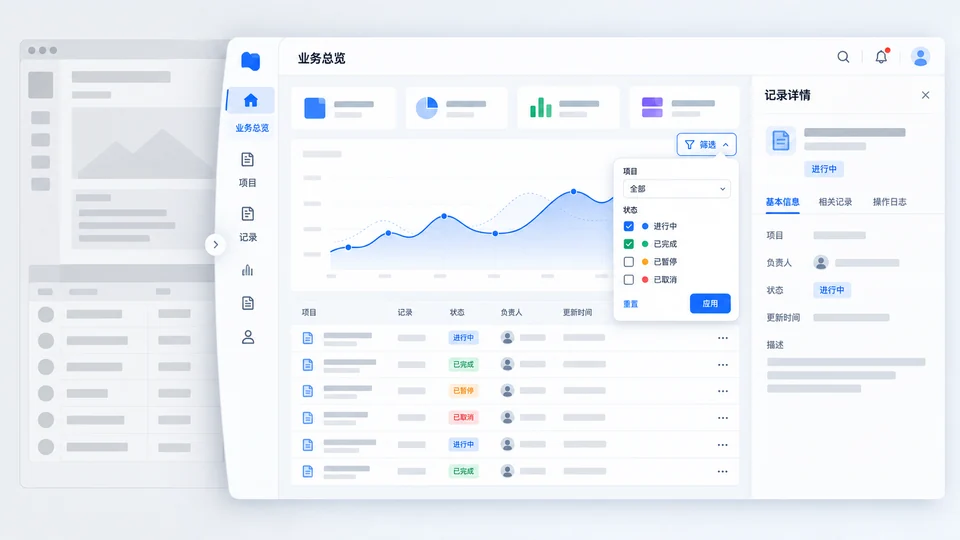
Page design · Interface revision · Front-end implementation
Design software, dashboard and multi-device interfaces, and deliver layout, visual files and interaction states. Design can be commissioned alone or with front-end implementation.
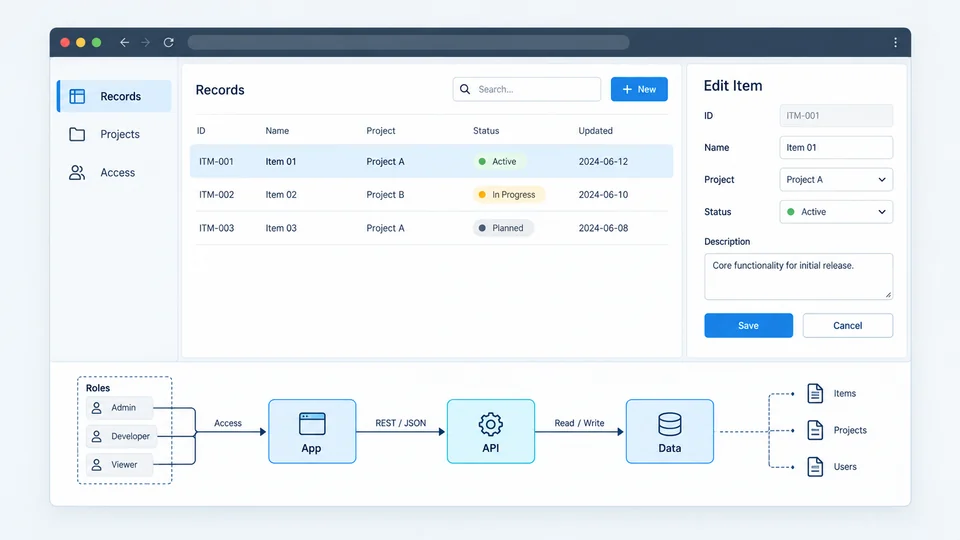
Business analysis · Software development · Test and handover
Build forms, approvals, ledgers and search, configure roles and permissions, and hand over design, code and tests as agreed.
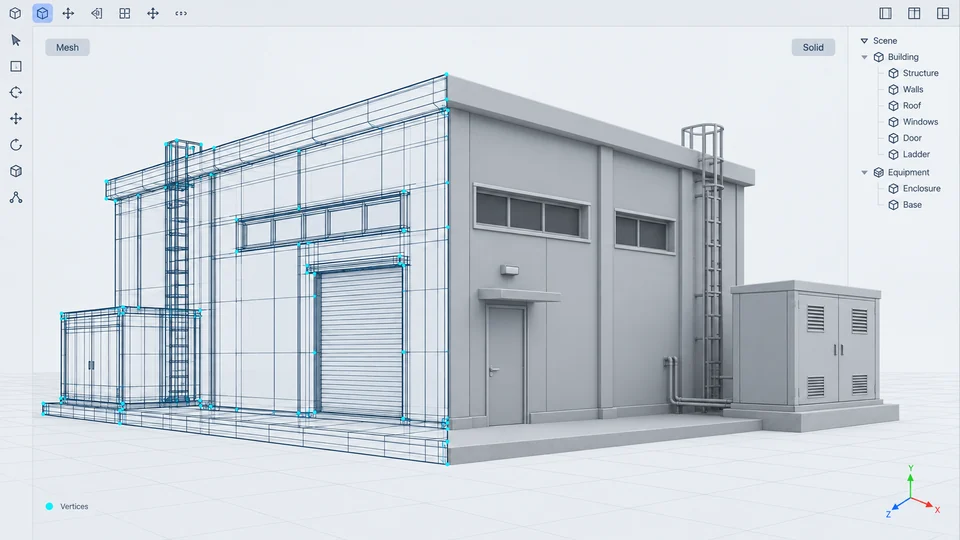
Model production · Asset preparation · Display fitting
Build building, equipment and space models from drawings, photos or existing models, and fit them to the target device. Precision, deliverables and usage rights are confirmed separately.
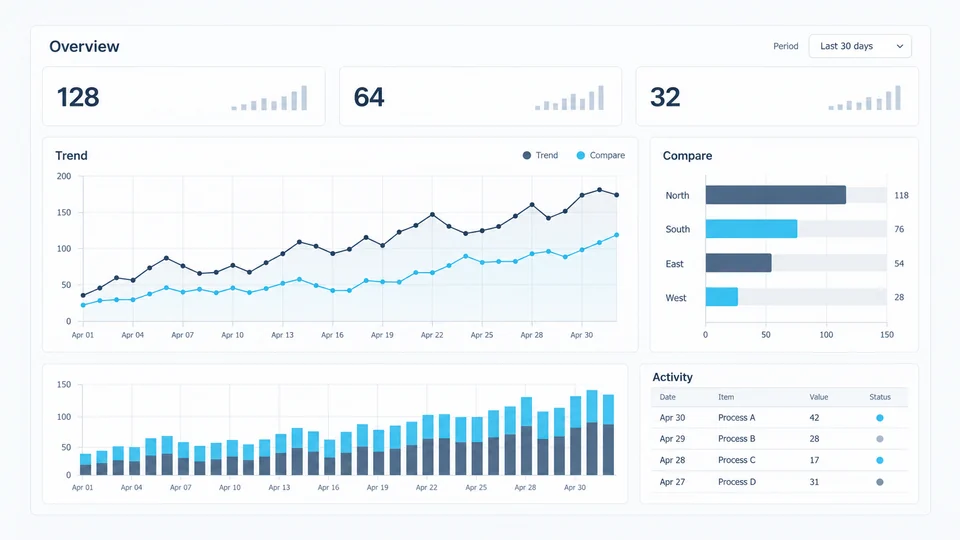
Indicators · Data access · Dashboard development
Connect Excel, databases or system APIs, and build indicators, charts and drill-down pages with agreed definitions, permissions and refresh rules.
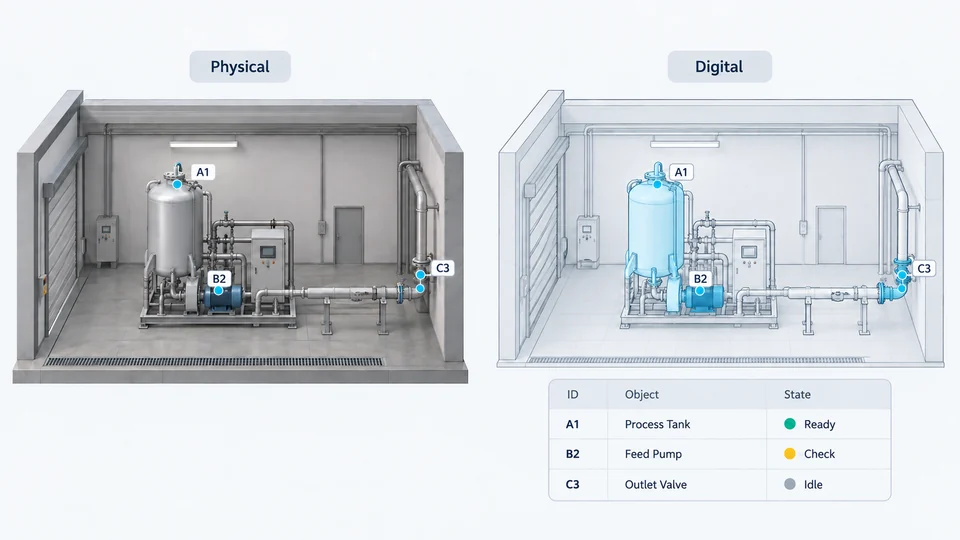
Spatial objects · Point binding · Business linkage
Link park, factory or equipment models with business data so status and events can be shown in the scene. The connection scope follows the assets, interfaces and devices already available.
Revise, take over or extend existing software, design files, BI platforms and Unity or Unreal projects after checking materials, dependencies, interfaces and whether the project runs.
Model production, scene interaction or data binding can be commissioned separately. Scope follows the existing assets, target devices and maintenance needs.
Confirm the goal and scope first, then design, build, deploy, accept and hand over.
Choose a dashboard, BI cockpit, business system or digital twin from the display goal, data sources, users and delivery scope.
Confirm the business goal, users, feature scope, indicator definitions, data sources, refresh frequency and launch plan.
Complete the prototype, UI, front and back office, permissions and interface testing, and deliver code, design files or 3D assets within the agreed scope.
Private deployment is available. Deployment, interfaces, accounts and instructions are handed over. Acceptance checks features, data, screen fit and response. Maintenance can continue after launch.
It usually includes requirements, indicator review, prototype, UI, front-end development, data interfaces, joint testing, deployment, acceptance and launch maintenance.
Yes. BI work focuses on indicator definitions, data organization, analysis and permissions. An executive cockpit organizes pages around management roles, operating questions and review. They can share definitions, queries and maintenance.
Yes. The back office can handle entry, workflow, permissions and summaries. The dashboard or cockpit shows the main indicators and operating status.
Yes, on the company's own servers, an internal network or a cloud server, once the domain, HTTPS, database, interfaces and operations responsibility are confirmed.