What does the page bring together?
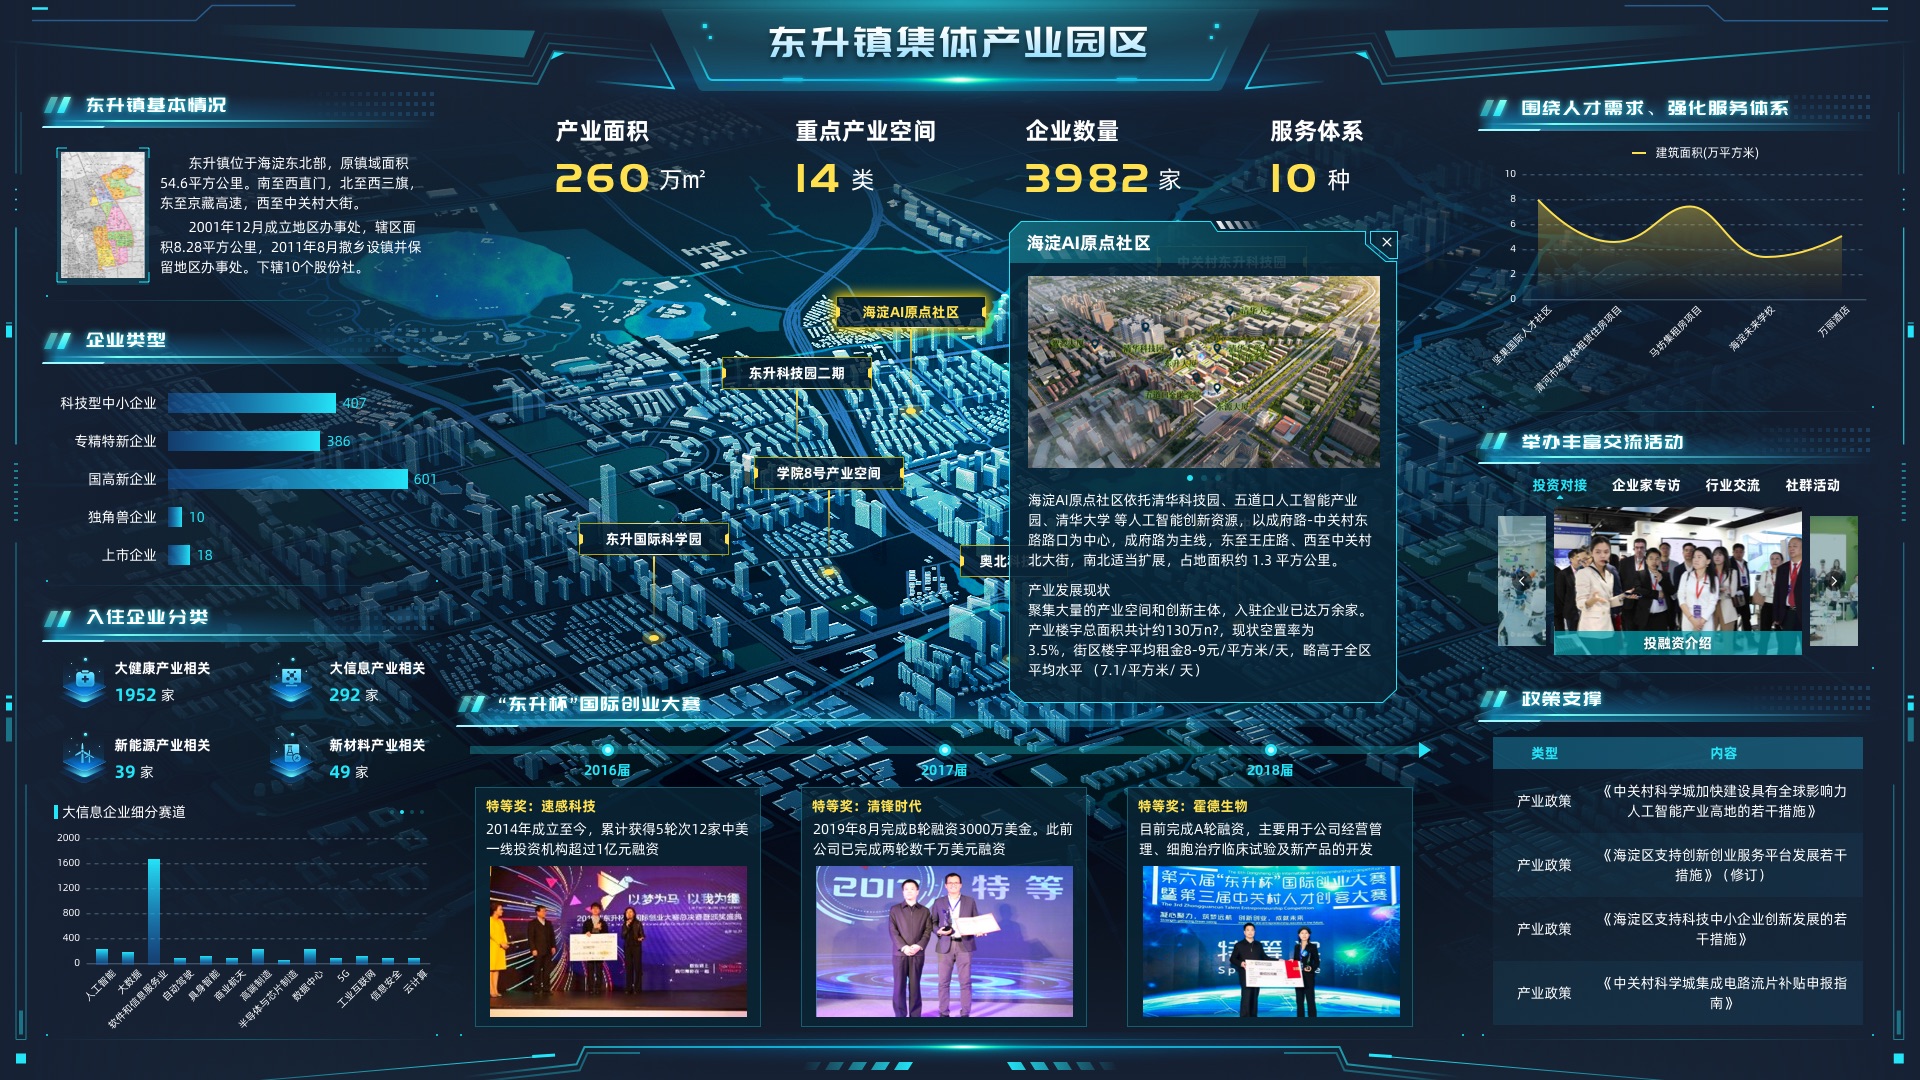
The park overview, industrial-space distribution, company types and industries, talent services, exchange events, policy support and startup-competition results.
The project uses the park’s space as the main line and brings industrial space, company profiles, talent services, events, policy support and a startup-competition result onto one operations screen for investment briefings, company services and progress reports.
Park operations involve space, company structure, investment services, talent events, policy resources and results. When those records are separate, it is hard to explain in one briefing which spaces exist, which companies have gathered, what services are being provided, and what results have formed.
This case builds one operations view for the Dongsheng Town collective industrial park. A 3D park is the center. Scale, priority areas, company types, industry categories, service events, policy support and the startup competition sit on one 16:9 screen.
| Module | Page content | Business value |
|---|---|---|
| Park overview | Area summary, industrial area, industrial space, company count and service lines | Set the park’s scale and operating boundary on the first screen, for briefings and receptions. |
| Industrial space | 3D map, labels for priority parks and industrial space, area popups | Put leasable space on the map so distribution and priority areas are clear. |
| Company profile | Qualification types, priority industries and the company mix | Move from a headcount of companies to quality and clustering, for investment and company services. |
| Talent and services | Building-space trend, talent demand, investment matching, interviews, exchange and community events | Show the services the park provides around company growth. |
| Policy support | Industry policy, innovation measures, support for technology companies and application guides | Help companies see which policy directions to watch, and leave a place for a later policy-service entry. |
| Competition results | Competition timeline, award-winning companies, and a short note on financing and product progress | Turn an event into a result that can keep being shown. |
| Data type | Usual source | What the page can support |
|---|---|---|
| Spatial assets | GIS, park boundary, building ledger, CAD drawings, 3D model | Park location, area labels, and drill-down for buildings and industrial space. |
| Company profile | Company directory, investment system, CRM, qualification and industry tags | Company categories, industry distribution, priority companies and the investment mix. |
| Service operations | Company-service ledger, event registration, visit records, investment-matching records | Service counts, event progress, company requests and an operations review. |
| Policy items | Policy library, application guides, handling status, document lists | Policy categories, who they apply to, application reminders and service progress. |
| Competition results | Editions, entries, awards, company-growth records | A competition timeline, representative companies and stage results. |
The park overview, industrial-space distribution, company types and industries, talent services, exchange events, policy support and startup-competition results.
Park boundaries and spatial assets, building ledgers, company directories and qualification tags, investment operations, event services, policy items, competition results, and map or 3D scene data.
Industrial parks, innovation parks, street renewal, investment centres, company service centres and results briefings. It can also become a daily operations cockpit.
About this case: This page shows the project screen within what may be published. Indicators, company counts, policy names and event information are as shown at the time of the screenshot and may change with park operations and policy. This page is not a live statistic or a basis for a policy application.