Trade union organization and inclusive-services data platform
Two screens, one for organization analysis and one for inclusive services, keep union structure, membership, voucher flow and content reach as separate reading topics.
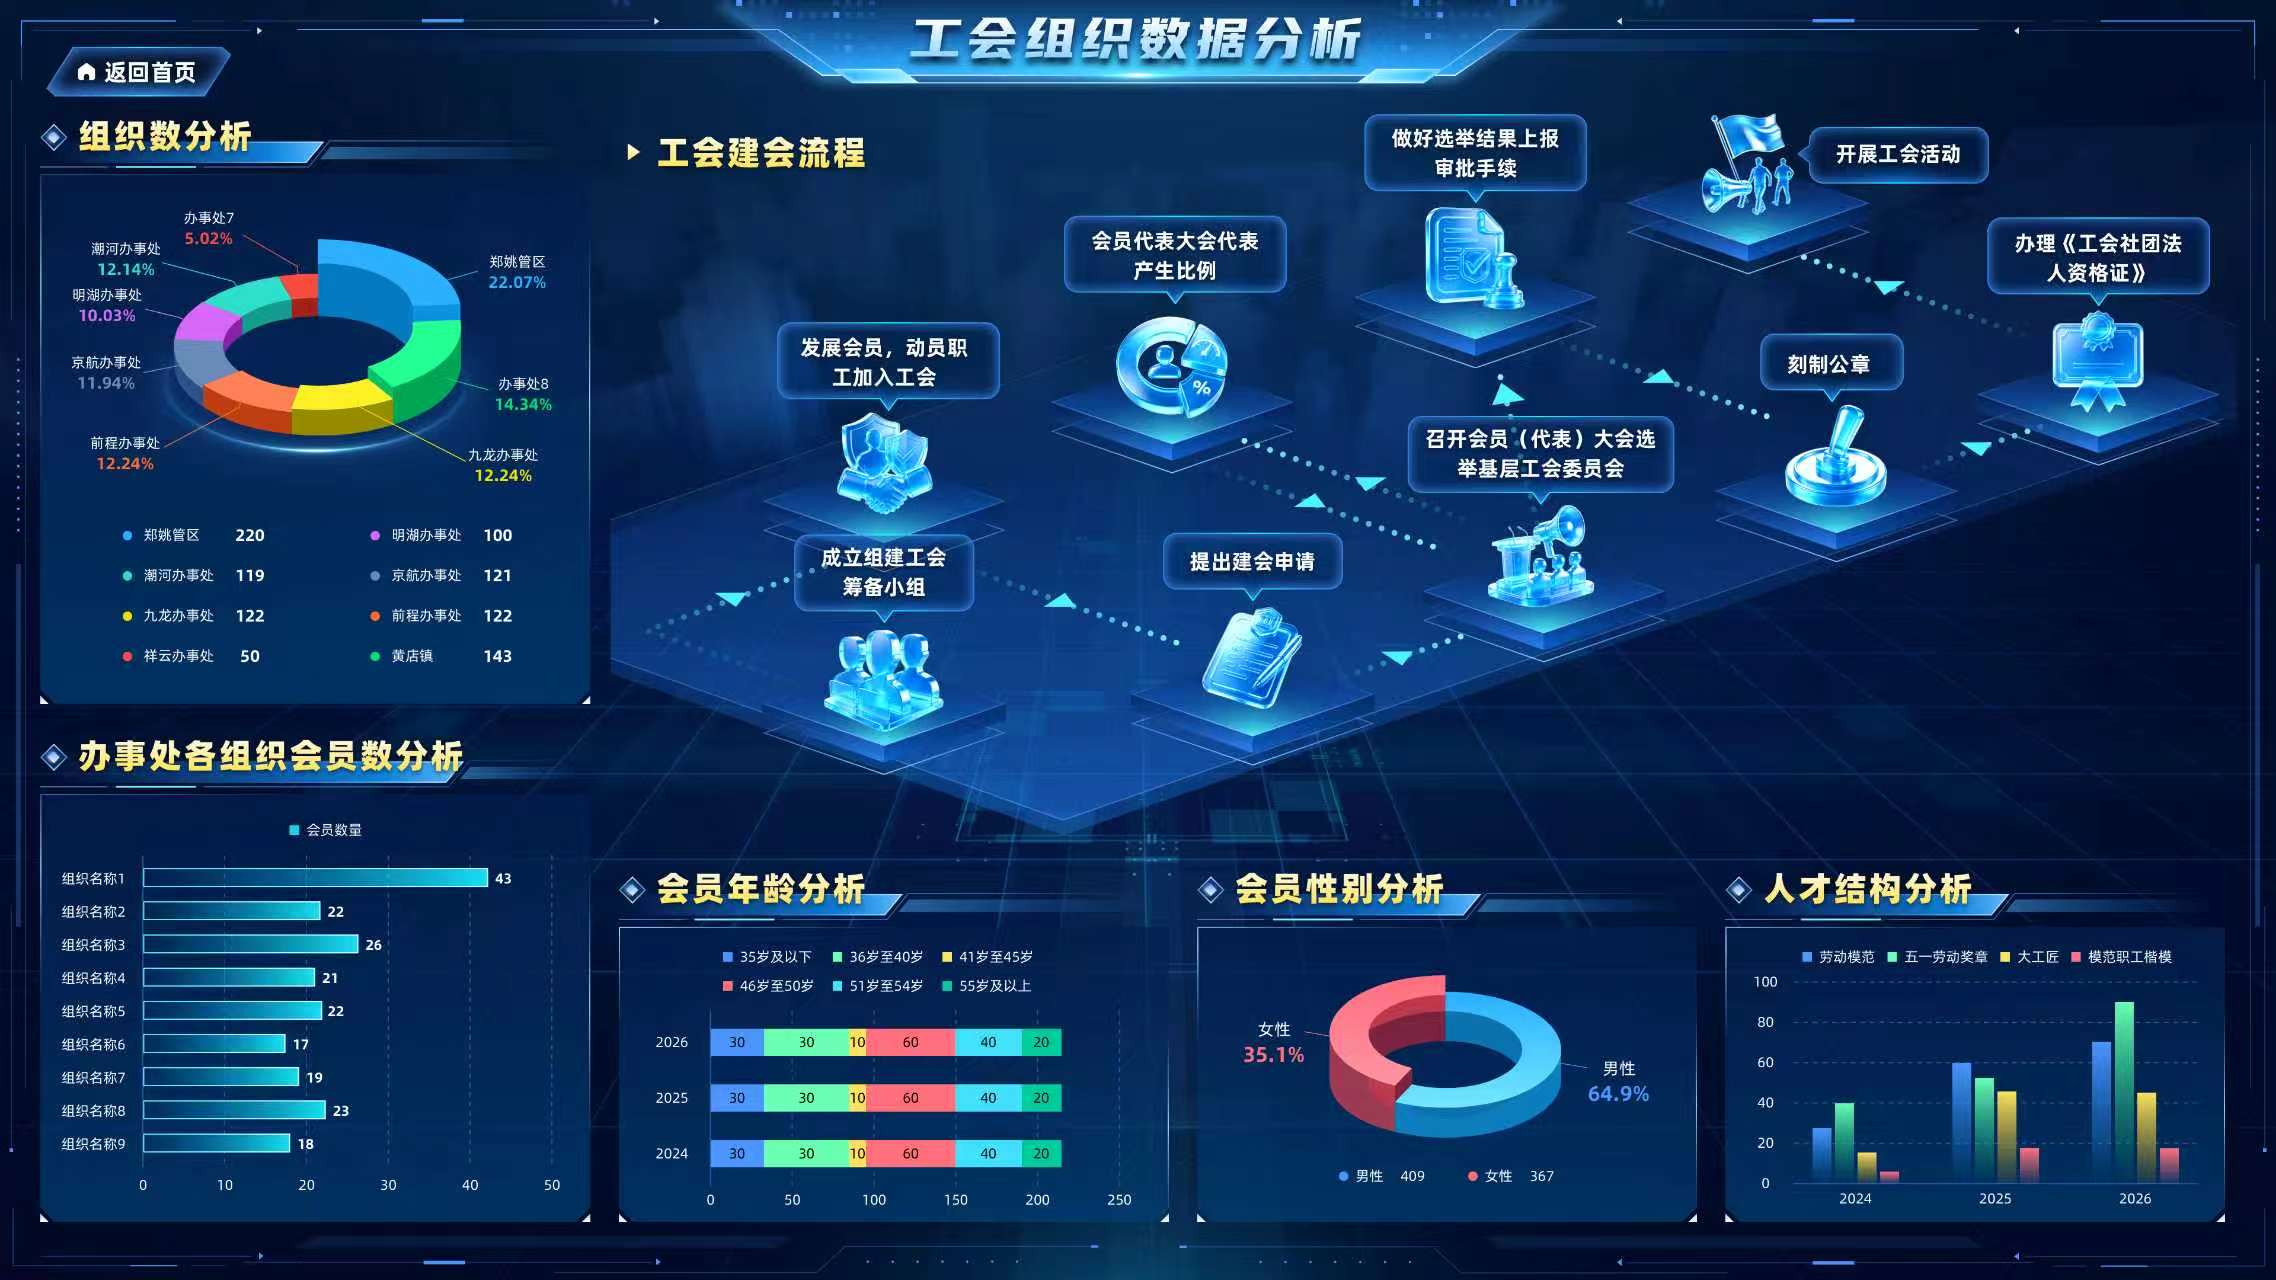
Organization analysis: distribution and membership sit around the union-setup flow.
Organization and membership
The organization page centers on the setup flow. The left side shows how many organizations and members sit in each region. The bottom adds age, sex and talent structure. Flow and statistics stay side by side, so the page does not collapse every topic into one row of totals.
Organization distribution: A ring chart with a regional breakdown shows organization count and share. A horizontal bar chart compares membership across organizations.
Union setup flow: Connected steps show preparation, member development, application, election and what follows. This is how the project screen expresses the flow. It does not show that any particular organization has completed those steps, and it is not a procedure to follow.
Membership structure: Age groups, sex share and talent categories use a stacked bar, a ring and a column chart. Each chart answers its own question. The categories should not all be treated as mutually exclusive groups.
For a similar page, agree organization IDs, region and which organization a member belongs to. After a merger, closure or transfer, also agree how history is assigned, or a period’s regional sum may not match the total.
Inclusive services and content reach
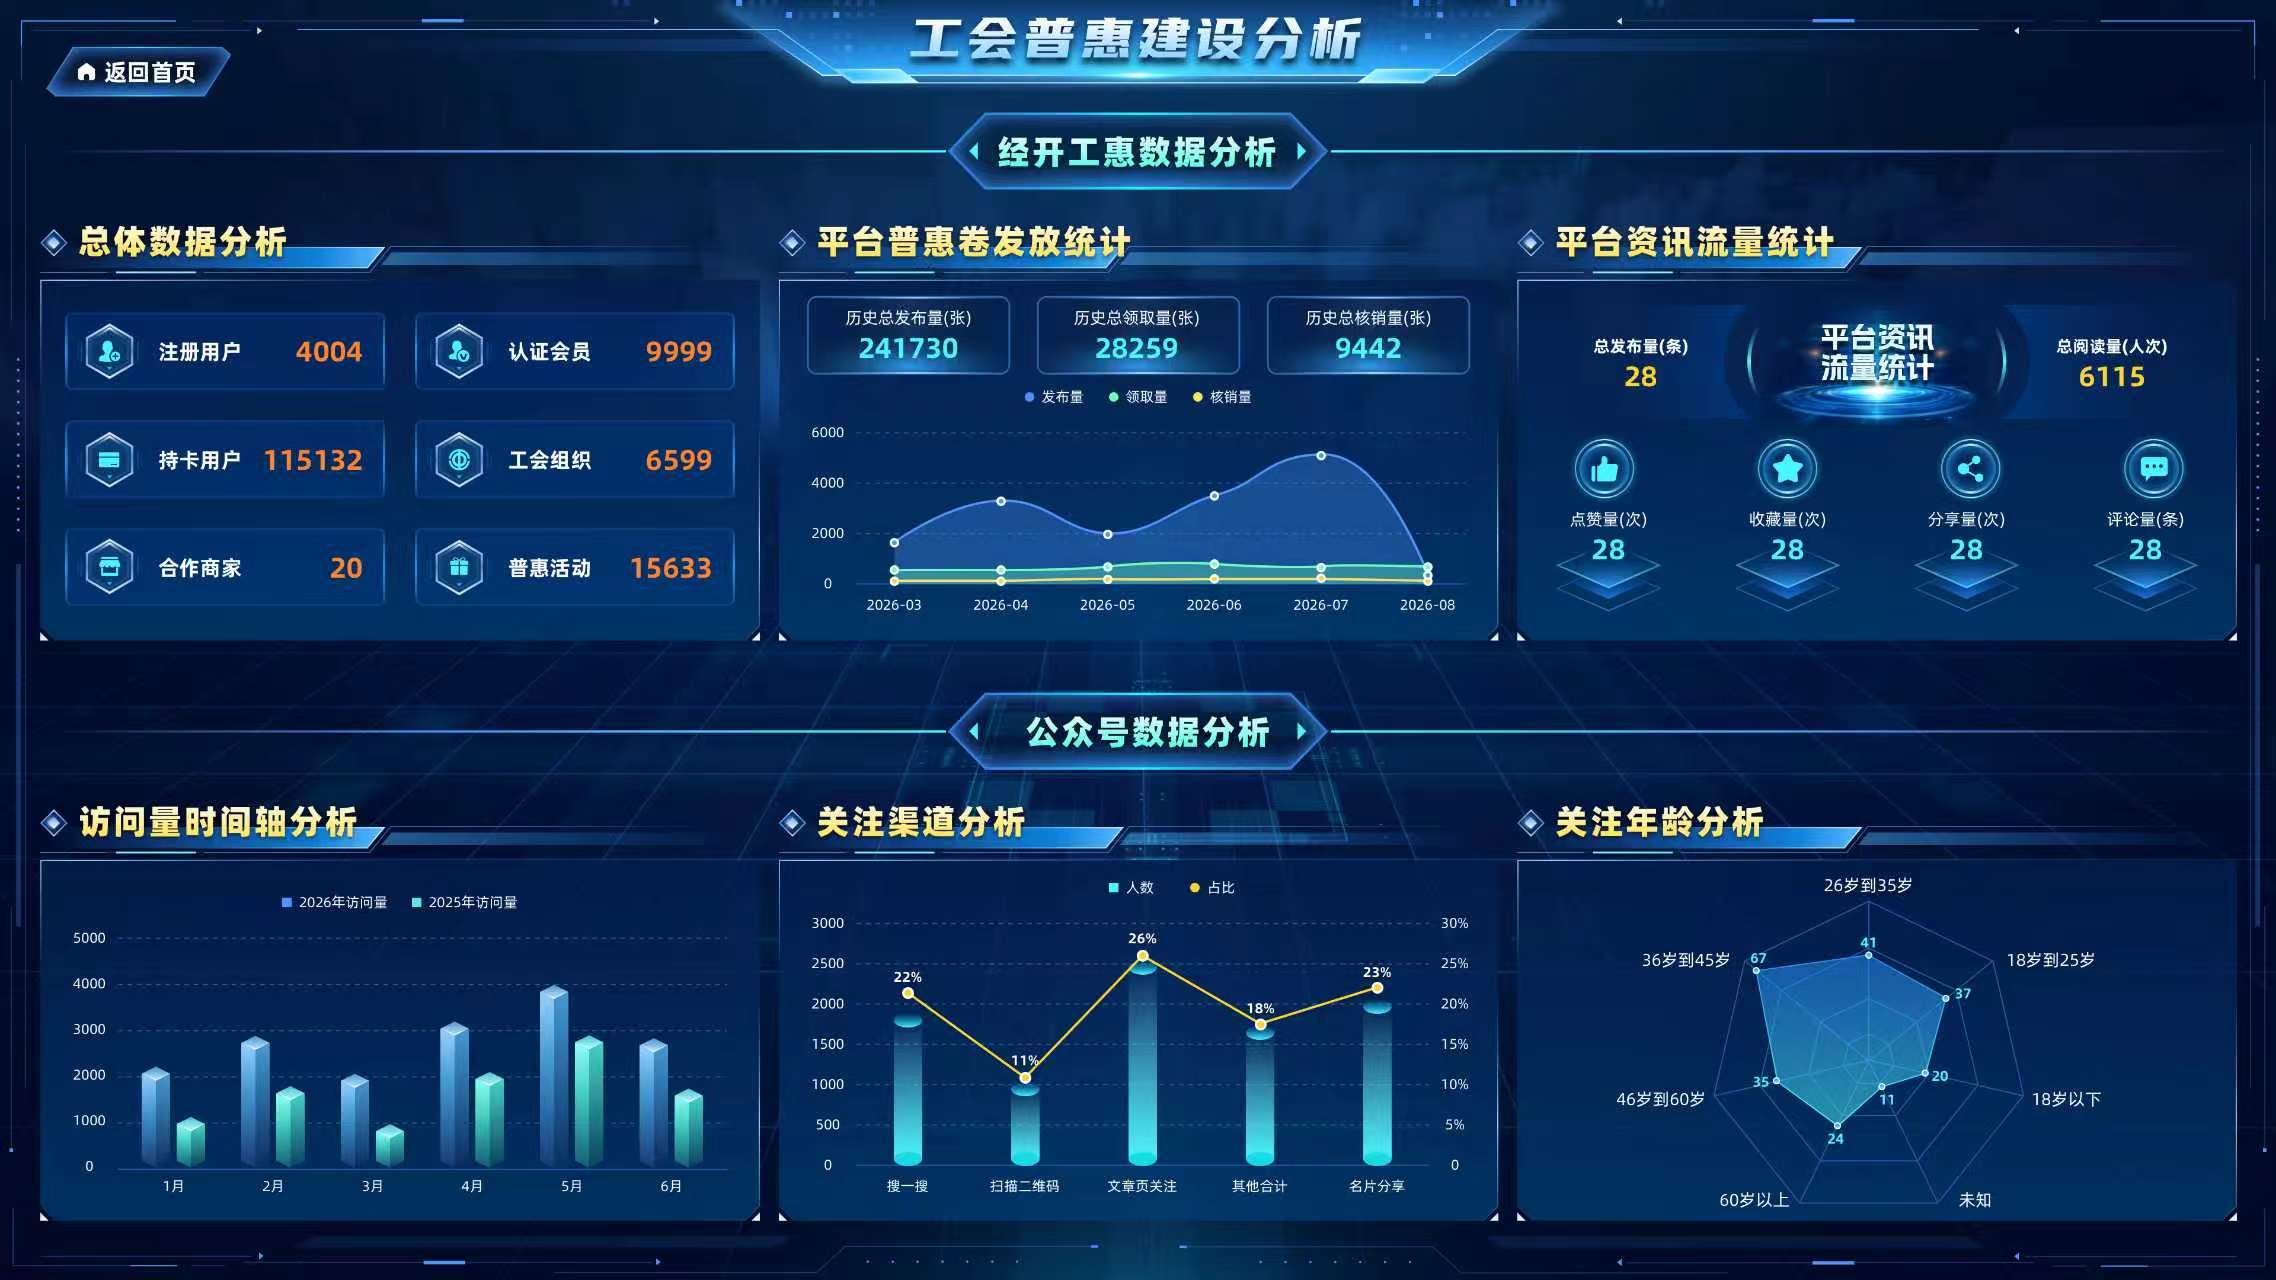
The inclusive-services page splits the business platform and the public account. The upper half shows users, members, partner merchants and activities, plus voucher issue, claim and redemption and content interaction. The lower half shows visits over time, follow channels and age of followers.
Inclusive-services analysis: platform activity and public-account reach are shown in separate areas.
Read this pair of pages by separating people who use a service, the path a voucher takes, and visits or interactions with content. Member count is people, voucher count is pieces, and reads may be visits. They should not be added or ranked together only because they share a screen. A trend also needs a stated date: activity date, claim date or redemption date.
Agree the counting rules first
Who counts as a member: Registration, verification and card holding are different states. Confirm whether closed accounts are included and whether a stable identifier can treat them as the same member.
Voucher period: Issue, claim and redemption need the voucher batch and its validity. A voucher redeemed this month may have been claimed last month, so the monthly totals are not a complete conversion.
Content measures: Number of posts, reads and likes need their own units. Public-account visits and platform visits should not be merged unless the de-duplication rule, and the visits that cannot be identified, are stated.
Age and talent categories: Age groups need a reference date and the boundary of each group. If talent categories overlap, keep the overlap. Do not force them to add up to 100 percent.
These are preparation notes for a similar project. They do not mean the system in the screenshot already has these interfaces, checks or de-duplication. Coverage, refresh, history and live status need other project records.
How to prepare and check a similar project
Start with the organization hierarchy, indicator notes, member-status definitions, voucher state changes, and the statistics fields the platform and public account can provide. Handle personal information within the authorized scope. A demonstration screen should use summaries, not full identity or contact details.
Set the boundary.Use one organization range and one time period as the check sample, and record who owns each indicator and when it was updated.
Check totals and groups.Check that groups add up to the total, whether a member is counted in more than one organization, and whether unclassified records are missing. States that should be excluded need a clear definition.
Follow one voucher batch.Check detail against summary from issue to claim to redemption. If cancellation, expiry or reversal records exist, confirm whether they are counted and how they are reversed.
Separate an exception from zero.A source that did not respond, a delayed update and a true zero need different signals, so a normal-looking page does not hide an unexplained change.
Why are organization analysis and inclusive services on two pages?
They answer different questions. Organization analysis is about distribution, the setup flow and membership. Inclusive services are about platform use, voucher flow and content reach. Splitting them avoids stacking every indicator on one screen. A comparison across pages still needs the same period and organization range.
Can registered users, verified members and card holders be added together?
Not from the labels alone. One person may be in more than one group, and the figures may use different periods. Agree identity and de-duplication first, then see whether the groups contain, overlap or exclude each other.
Can voucher issue and redemption totals show the effect of the service?
Not from the two totals alone. Check the batch, claim time, validity, cancellation or refund, and when redemption happened. Comparing activities also means separating people from actions, and not mixing a historical total with the current period.