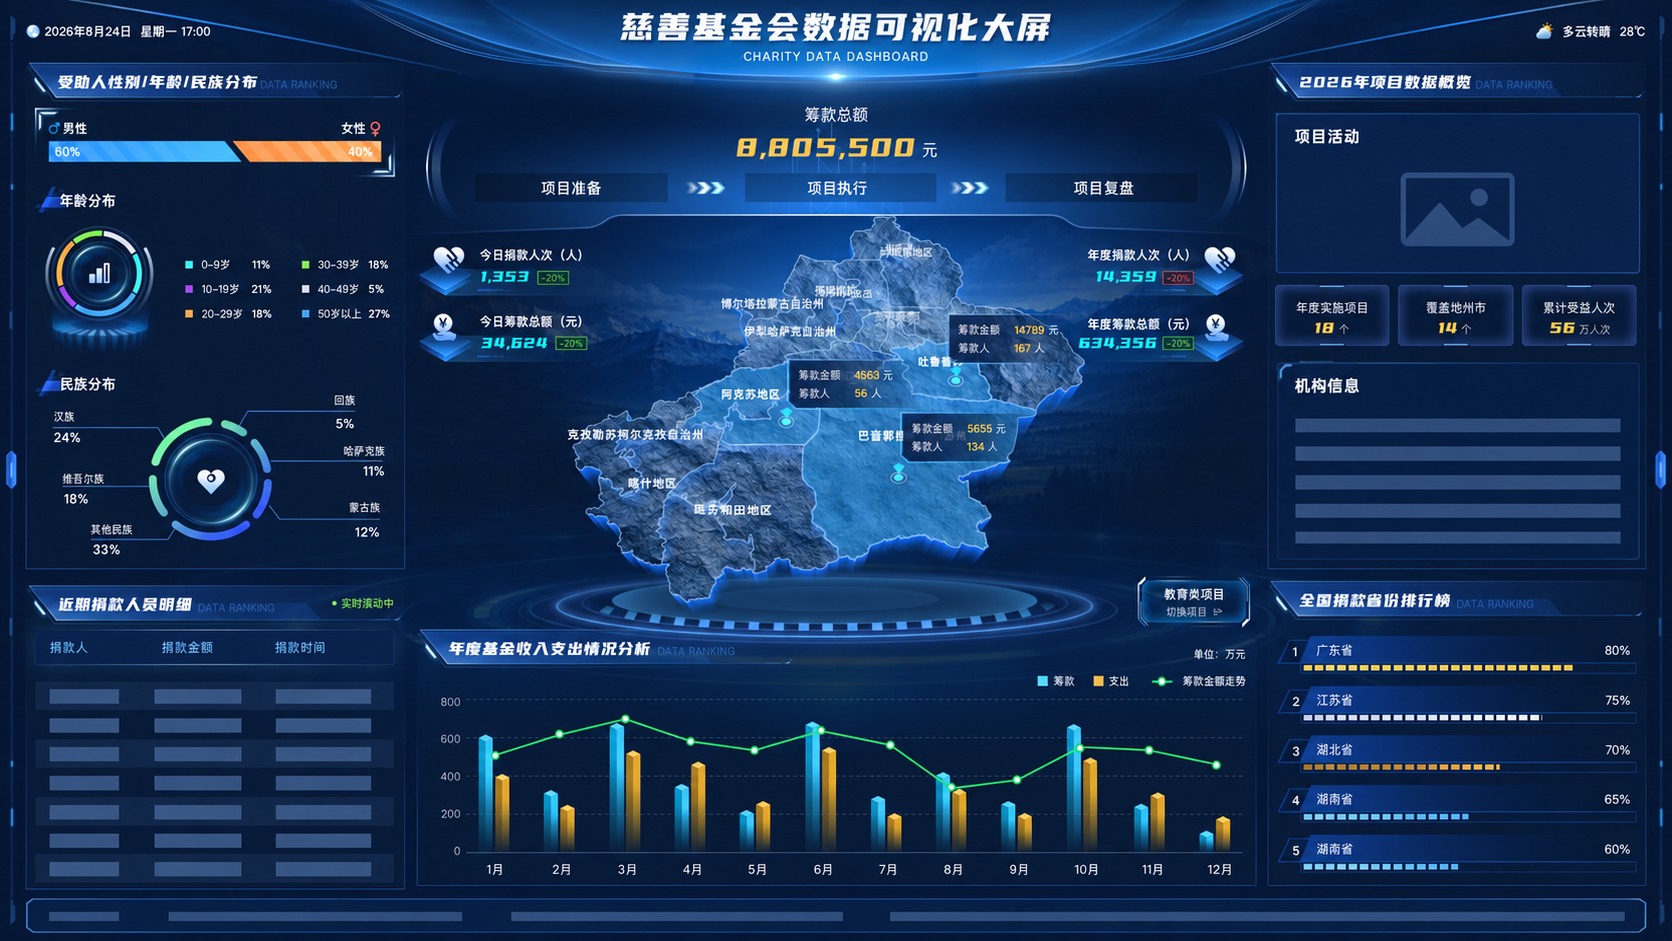
Fundraising overview, regional distribution, beneficiary structure and annual projects sit on one screen, with income and expense trends and activity information.
The fundraising map is in the center. Beneficiary structure, project overview and fund trends sit in separate areas.
From the fundraising overview to projects and people
The center sets the reading order with the fundraising overview and regional map. Around it are beneficiary structure, project overview, donation-source ranking and monthly income and expense. Totals show scale, the map shows place, trends show change over the period, and project and activity information adds context.
Fundraising and region: Cumulative, daily and annual figures are kept apart. The map labels amount and number of people by area. Different time ranges sit side by side so the scale of each figure is clear.
Beneficiary structure: Sex, age and ethnicity are shown as separate grouped charts. Each group should use the same population. Missing or unclassified records need an explicit rule.
Projects and activities: Project count, coverage, beneficiary visits and the activity area are grouped so they can be read against the fundraising overview.
Income, expense and source: Monthly charts show income, expense and fundraising trends together. A regional ranking adds source information. Detail and activity areas hold itemized records and updates.
The overview is clear only if the statistical boundary is clear
A row of totals is not enough to judge whether funds are sufficient, a project is complete, or coverage has grown. Before design and data access, record the time, subject, unit and fund status of each indicator, then decide which figures can be compared.
Time and batch: Cumulative, annual and daily amounts need a start and end. Receipts, refunds or reversals that cross a period should stay tied to the original batch so the same money is not counted twice.
Fund status: A pledge, a received amount and a settled amount are not the same status. Income and expense also need an agreed business date. A trend does not replace a check of the fund records or a financial conclusion.
People and visits: When one person donates more than once or joins more than one project, headcount, visits and benefit counts differ. Agree the de-duplication range before adding figures, and do not add different units together.
Place and share: Where a donation comes from, where a project is carried out, and where a beneficiary lives answer different questions. A ranking needs a stated denominator. Unknown places should not disappear from the count.
How to prepare and check a similar page
Build an indicator list.For totals, income and expense, project count and beneficiary visits, note the source, the counting rule, the update cycle and who confirms the figure. Check one period first.
Keep a traceable link.Prepare project IDs, fund batches and region codes. The public screen uses summaries. Detailed checks stay within the authorized scope.
Check how totals relate.Use a confirmed sample to see whether months add up to the year, how income and refunds are treated, and whether a person helped by more than one project is counted as agreed.
Check the display boundary.On the target screen, confirm that place names, units and long text stay readable. Missing data, a delayed update and a true zero must look different. They cannot all appear as zero.
Why can’t cumulative fundraising be compared directly with the annual amount?
The two figures may cover different dates, or use receipt, confirmation or settlement. Check the dates, fund status and refunds first, then compare the same period and the same rule. A larger number on the screen is not by itself an error.
Can donation visits be treated as unique donors?
No. One person may donate more than once in the same period. Visits and de-duplicated people answer different questions. Unique people need an identity and de-duplication rule. Anonymous records that cannot be linked should be stated separately, not merged.
Does a regional ranking show how far a charity project reaches?
No. Donation source, project location and beneficiary location are different. The ranking must say which one it uses. Coverage also depends on project scope, who is helped and when the work is carried out.