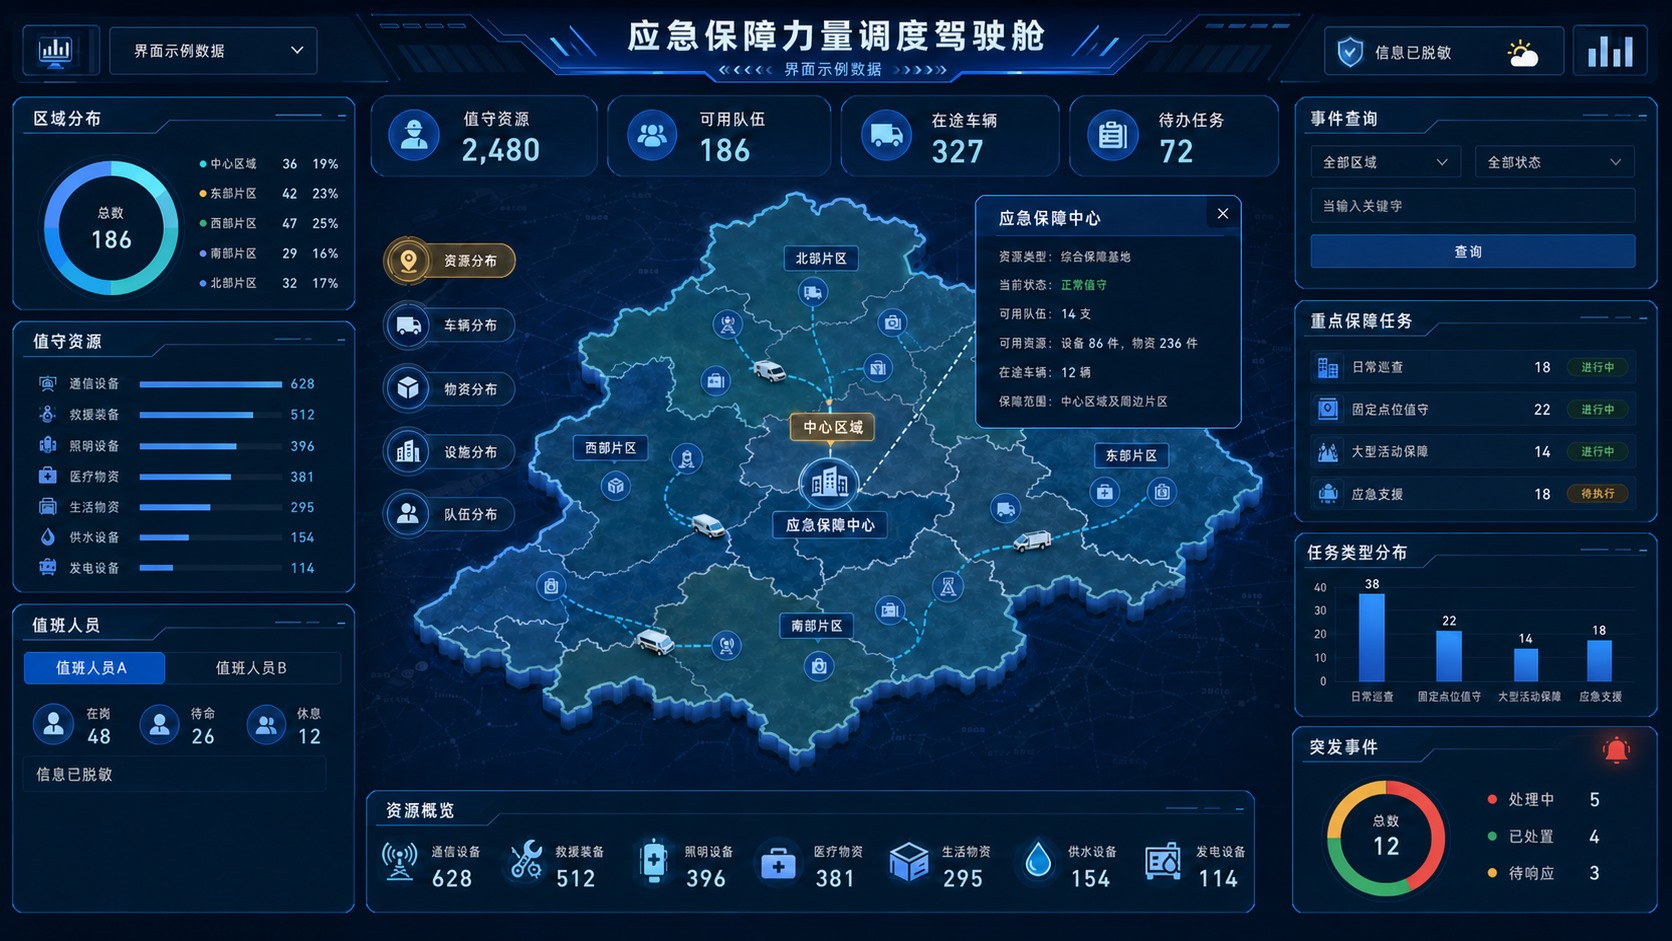
Emergency support resource dispatch cockpit, anonymized
The cockpit uses an abstract regional map to place duty resources, teams and vehicles, supplies and facilities, priority tasks, event search and incident trends on one situation view, so duty staff can locate resources and task status.
Industry
Emergency support, duty dispatch and regional coordination
Page use
Situation overview, resource search and task review
What is shown
Geography, people, organizations, tasks and numbers are all desensitized
Redrawn anonymized emergency dispatch cockpit. Real outlines, people, organizations, tasks, times, exact quantities and equipment have been replaced with an abstract region, civilian emergency resources and sample data.
Core viewAbstract regional map and resource situation
Visible resourcesTeams, vehicles, supplies and facilities
How tasks are organizedSearch, category, status and trend
Case statusRedrawn and desensitized, with sample interface data
What the screen shows
An emergency-support scene has to judge available resources, task location, coverage and how events are changing in a short time. The cockpit is not a stack of numbers. It is a reading path: judge the totals, locate them on the map, search the task, then open the resource.
The main image is redrawn from the information structure of the original screen. The map outline is a fictional abstract region. Names, organizations, real places, task names, times, exact quantities and sensitive equipment fields have been removed. The page explains the visible layout and how modules relate. It does not by itself prove an interface connection, a live refresh, location precision or a handling result.
How the information is arranged
Top overview: duty resources, available teams, vehicles on the way and open tasks.
Center situation map: abstract regions, points, routes and a detail overlay.
Left resource inventory: regional distribution, equipment and supply categories, and the duty status that is needed.
Right task review: event search, priority support tasks, task type and status.
Bottom resource overview: communication, rescue, lighting, medical, living, water and power resources in a form that can be compared.
Incident module: in progress, handled and waiting for a response, so a backlog is visible.
Modules and what each one does
Module
Suggested content
Main job
Duty overview
Duty resources, available teams, vehicles on the way, open tasks
Let duty staff judge the current load and what can be dispatched.
Regional situation
Abstract regions, resource points, task points, routes and a detail overlay
Put resource location, coverage and task status in one spatial view.
Resource distribution
Teams, vehicles, communication, rescue, medical, living and energy supplies
Find available resources by type and region, and see a shortage.
Priority tasks
Task type, responsible team, current status, time points and open items
Support patrols, fixed posts, large-event support and emergency assistance.
Event search
Region, status, keyword, time range and event level
Filter current events and open the detail and handling record.
Trend review
Event count, task type, response status and how handling changes
See task structure and backlog, as a basis for shifts and resource allocation.
Usual data sources and the access boundary
Data type
Usual source
What to confirm
Teams and duty
Organization ledger, shift system, person status and post permissions
Object codes, who can see what, the duty period, minimum personal information, and how updates work.
Vehicles and equipment
Vehicle ledger, equipment management, location service and maintenance records
Available state, location precision, offline rules, maintenance state and rights to historical tracks.
Supplies and facilities
Emergency store, warehouse system, facility points and stock ledger
Category codes, quantity definition, shelf life, transfer status and the minimum stock threshold.
Events and tasks
Event work orders, task management, alarm platform and manual reports
Event grading, state changes, responsibility, close conditions and duplicate events.
Map and region
GIS service, a licensed base map, region boundaries and business points
Coordinate system, map rights, the precision that may be published, sensitive points and caching.
Visual and interaction priorities
The map does the locating: The center shows resource points, task relationships and coverage. Detailed ledgers go in an overlay or a topic page.
Color expresses status: Blue for ordinary information, green for available or complete, yellow for waiting, and red only for a high-priority exception.
Filters apply to the whole screen: After a filter on region, resource type or task status, the map, lists, indicators and trends use the same condition.
Overview and detail are separate: The home screen keeps only what is needed to judge. A resource, task or event opens an auditable detail page.
Fit the real terminal: Before launch, confirm resolution, how screens are joined, browser zoom, viewing distance and the interaction device. Do not copy the design-file size as-is.
Permission, desensitization and acceptance
Separate a public version from an internal version: The website case, a briefing and an internal production terminal use different sources, fields and access control.
Minimize personal information: The large screen shows a post or a summary first, not names, contact details or personal files that the current task does not need.
Grade sensitive points: Location precision, region boundaries, task detail and resource quantities are authorized by role, organization and terminal.
Keep a trace of actions: Search, dispatch, status changes, export and permission changes keep the audit log that is needed.
Accept in layers: Interface, data definitions, interfaces, permissions, map rights, performance, logs and the final large-screen terminal are accepted separately. A screenshot does not replace a test record.
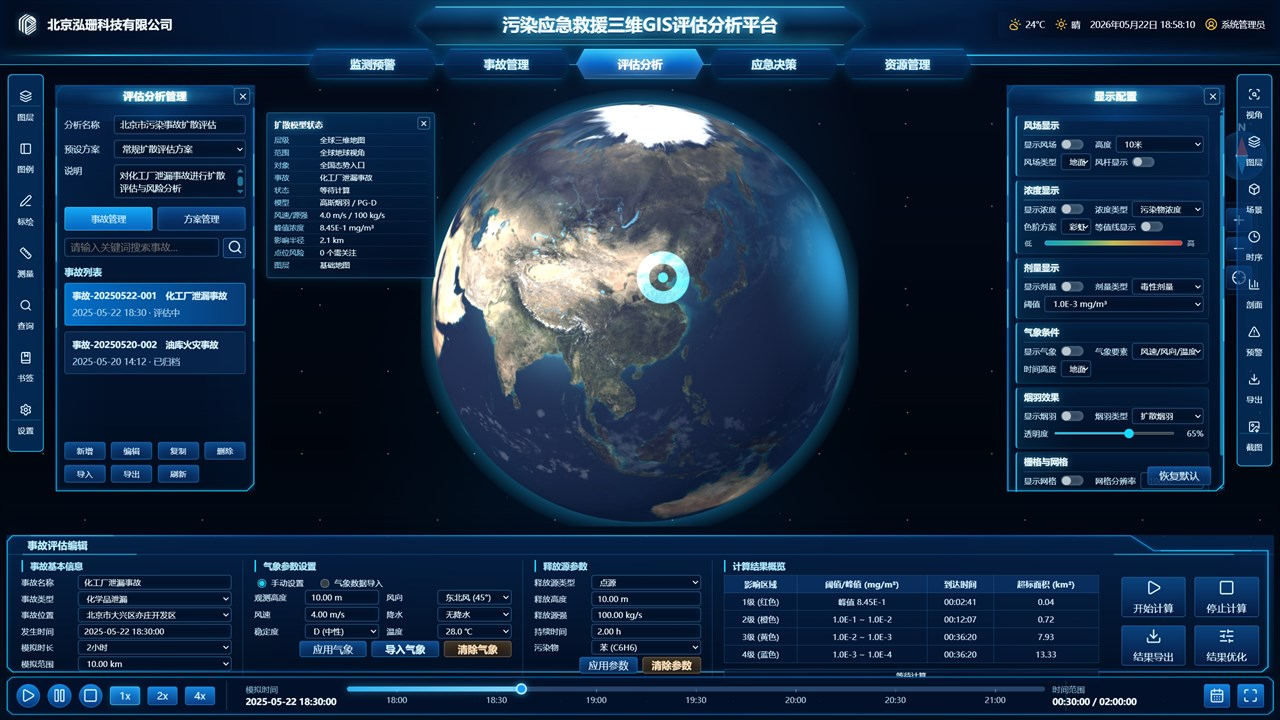
An extension topic: GIS review of a pollution event
When the platform also has to handle pollution spread, a chemical leak or a regional environmental risk, a separate GIS review workspace can sit beside the resource overview. Event parameters, weather, a dispersion model, concentration grades, the affected area and rescue resources share that topic page.
Illustration of a pollution-event GIS review. Model calculation, live data and a handling conclusion need the interface, the algorithm note and test records. The screenshot only shows how the page is organized.
Where it can be extended
Emergency resource dispatch
Emergency resources on one map
Regional coordination command
Large-event support
Park emergency management
City operations duty
Supply and vehicle dispatch
Pollution-event GIS review
Questions
What does an emergency resource dispatch cockpit usually show?
Duty resources, available teams, vehicles on the way, open tasks, regional distribution, teams, vehicles, supplies and facilities, priority tasks, event search, task types and incident trends.
What data does an emergency resource screen need?
Usually team and duty ledgers, vehicle and equipment systems, the emergency store, facility points, event work orders, task management, a GIS service and an alarm platform, with shared codes, states, coordinates, update frequency and permissions.
Are the regions, people and tasks on the page real?
No. The main image is a redrawn, desensitized interface. Real geography, people, organizations, tasks, times, exact quantities and equipment detail have been removed and replaced with an abstract region, civilian emergency resources and sample data.
Related services and further reading
About this case: The main image is redrawn from the information structure after desensitization. The public image does not keep real outlines, names, customer or organization names, task detail, times, exact business quantities, equipment or sensitive points. It explains page structure and visual organization. It is not live operating data or a handling result, and it does not replace an authorization, an interface record, an algorithm note or acceptance material.