Must a smart energy dashboard use live data?
For duty and maintenance, live or near-live data is appropriate. For a concept check, a briefing or early planning, historical data, a sample table or simulated data can build the prototype first.
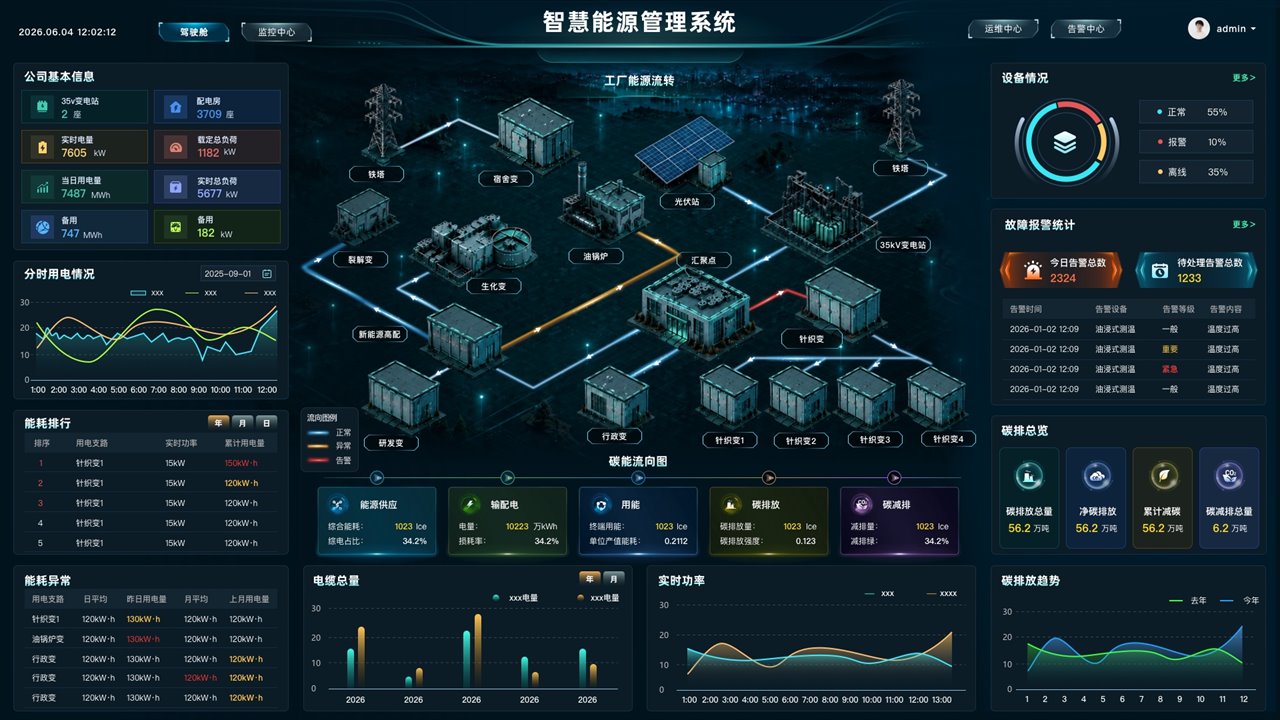
Summary: An energy management system is more than placing energy totals on one screen. It organizes plant energy flow, power-distribution equipment, live load, time-of-use electricity, fault alarms, maintenance and carbon indicators into one place that can be viewed, judged and traced. It fits factories, parks, energy stations, solar-storage-charging sites and an enterprise energy centre.
In a factory or park, electricity, distribution equipment, alarms, carbon and maintenance records often sit in different systems. Managers want to know whether today’s use is unusual, which equipment is at risk, whether an alarm was handled, and whether carbon figures can be added up. Maintenance staff need equipment state, alarm level and the handling record.
This case is the overview page. The center carries the energy-flow diagram and equipment layout. The sides carry company basics, time-of-use electricity, energy ranking, fault alarms, equipment and the carbon trend. The bottom adds supply, transmission, use, emissions and reduction.
The home screen can be one energy-flow diagram, operating indicators on the sides, and topic indicators along the bottom. The diagram shows supply, distribution, electricity use and carbon. The left suits company basics, time-of-use, ranking and exceptions. The right suits equipment, alarms, the carbon overview and the carbon trend. The bottom suits topic cards and trends.
| Page area | Suggested content | Main job |
|---|---|---|
| Center flow diagram | Towers, substations, solar sites, distribution rooms, production loads and line status | Show how energy moves and the state of key nodes |
| Left operating area | Base electricity, time-of-use, energy ranking and exceptions | Support review and finding an energy problem |
| Right monitoring area | Equipment state, alarm counts, alarm list, carbon overview and carbon trend | Support duty monitoring and handling exceptions |
| Bottom indicator area | Supply, transmission and distribution, use, emissions, reduction and live power | Hold the topic indicators managers watch |
| Data type | Usual source | What to confirm |
|---|---|---|
| Electricity and load | Smart meters, the energy system, a database | Period, sub-item rule, peak and valley rule, and refresh |
| Distribution equipment | Distribution-room system, PLC, IoT platform, equipment interface | Equipment code, running state, online or offline, and fault level |
| Solar and storage | Inverter, BMS, PCS, energy-platform interface | Generation, state of charge, charge and discharge power, and grid connection |
| Alarms and maintenance | Alarm platform, work-order system, back-office entry | Alarm level, handler, status and finish time |
| Carbon | Energy conversion rules, a carbon table, the business system | Emission factor, conversion rule, boundary and display period |
The cockpit answers whether the whole system is running normally. It should highlight total electricity, live load, today’s use, equipment online rate, alarm count and carbon, and not put every detail on the home screen.
The monitoring centre is for duty staff. It shows equipment, line status, sensor data and time-of-use trends. For a factory or park energy screen it usually serves both the large screen and a back-office view.
The maintenance centre follows an alarm from discovery to confirmation to completion. Show time, equipment, level, content, status and the handling record, and link a work order when that is in scope.
The alarm centre is not only a count. It should help locate a cause. Filter by equipment, area, level, time and status so staff can tell a fault, an unusual load, high temperature or a data interruption apart.
The carbon module can show total emissions, net emissions, cumulative reduction and the trend. If a low-carbon park view is needed later, carbon and energy indicators can share one data base.
Beijing Hongshan Technology Co., Ltd. can support an energy dashboard, a factory dashboard, a BI cockpit, an executive cockpit and a command-room visualization. Deployment can be cloud, internal network or private, according to the data-security requirement.
This example does not show a customer name, account or live business data. Indicators, modules and feature scope are confirmed for the actual project.
For duty and maintenance, live or near-live data is appropriate. For a concept check, a briefing or early planning, historical data, a sample table or simulated data can build the prototype first.
A report suits detail lookup and export. An energy dashboard puts energy flow, equipment state, alarm handling and trends in one view so managers and maintenance staff can judge the state quickly.
Yes. If a later phase needs the park, plant, distribution room or equipment in space, 3D modeling, a digital twin view and point linkage can be added on the energy and alarm data already in place.